

Horse Racing Favourites App
Using graphs
Graphs help you understand how a stat achieved its profit—not just the final number.
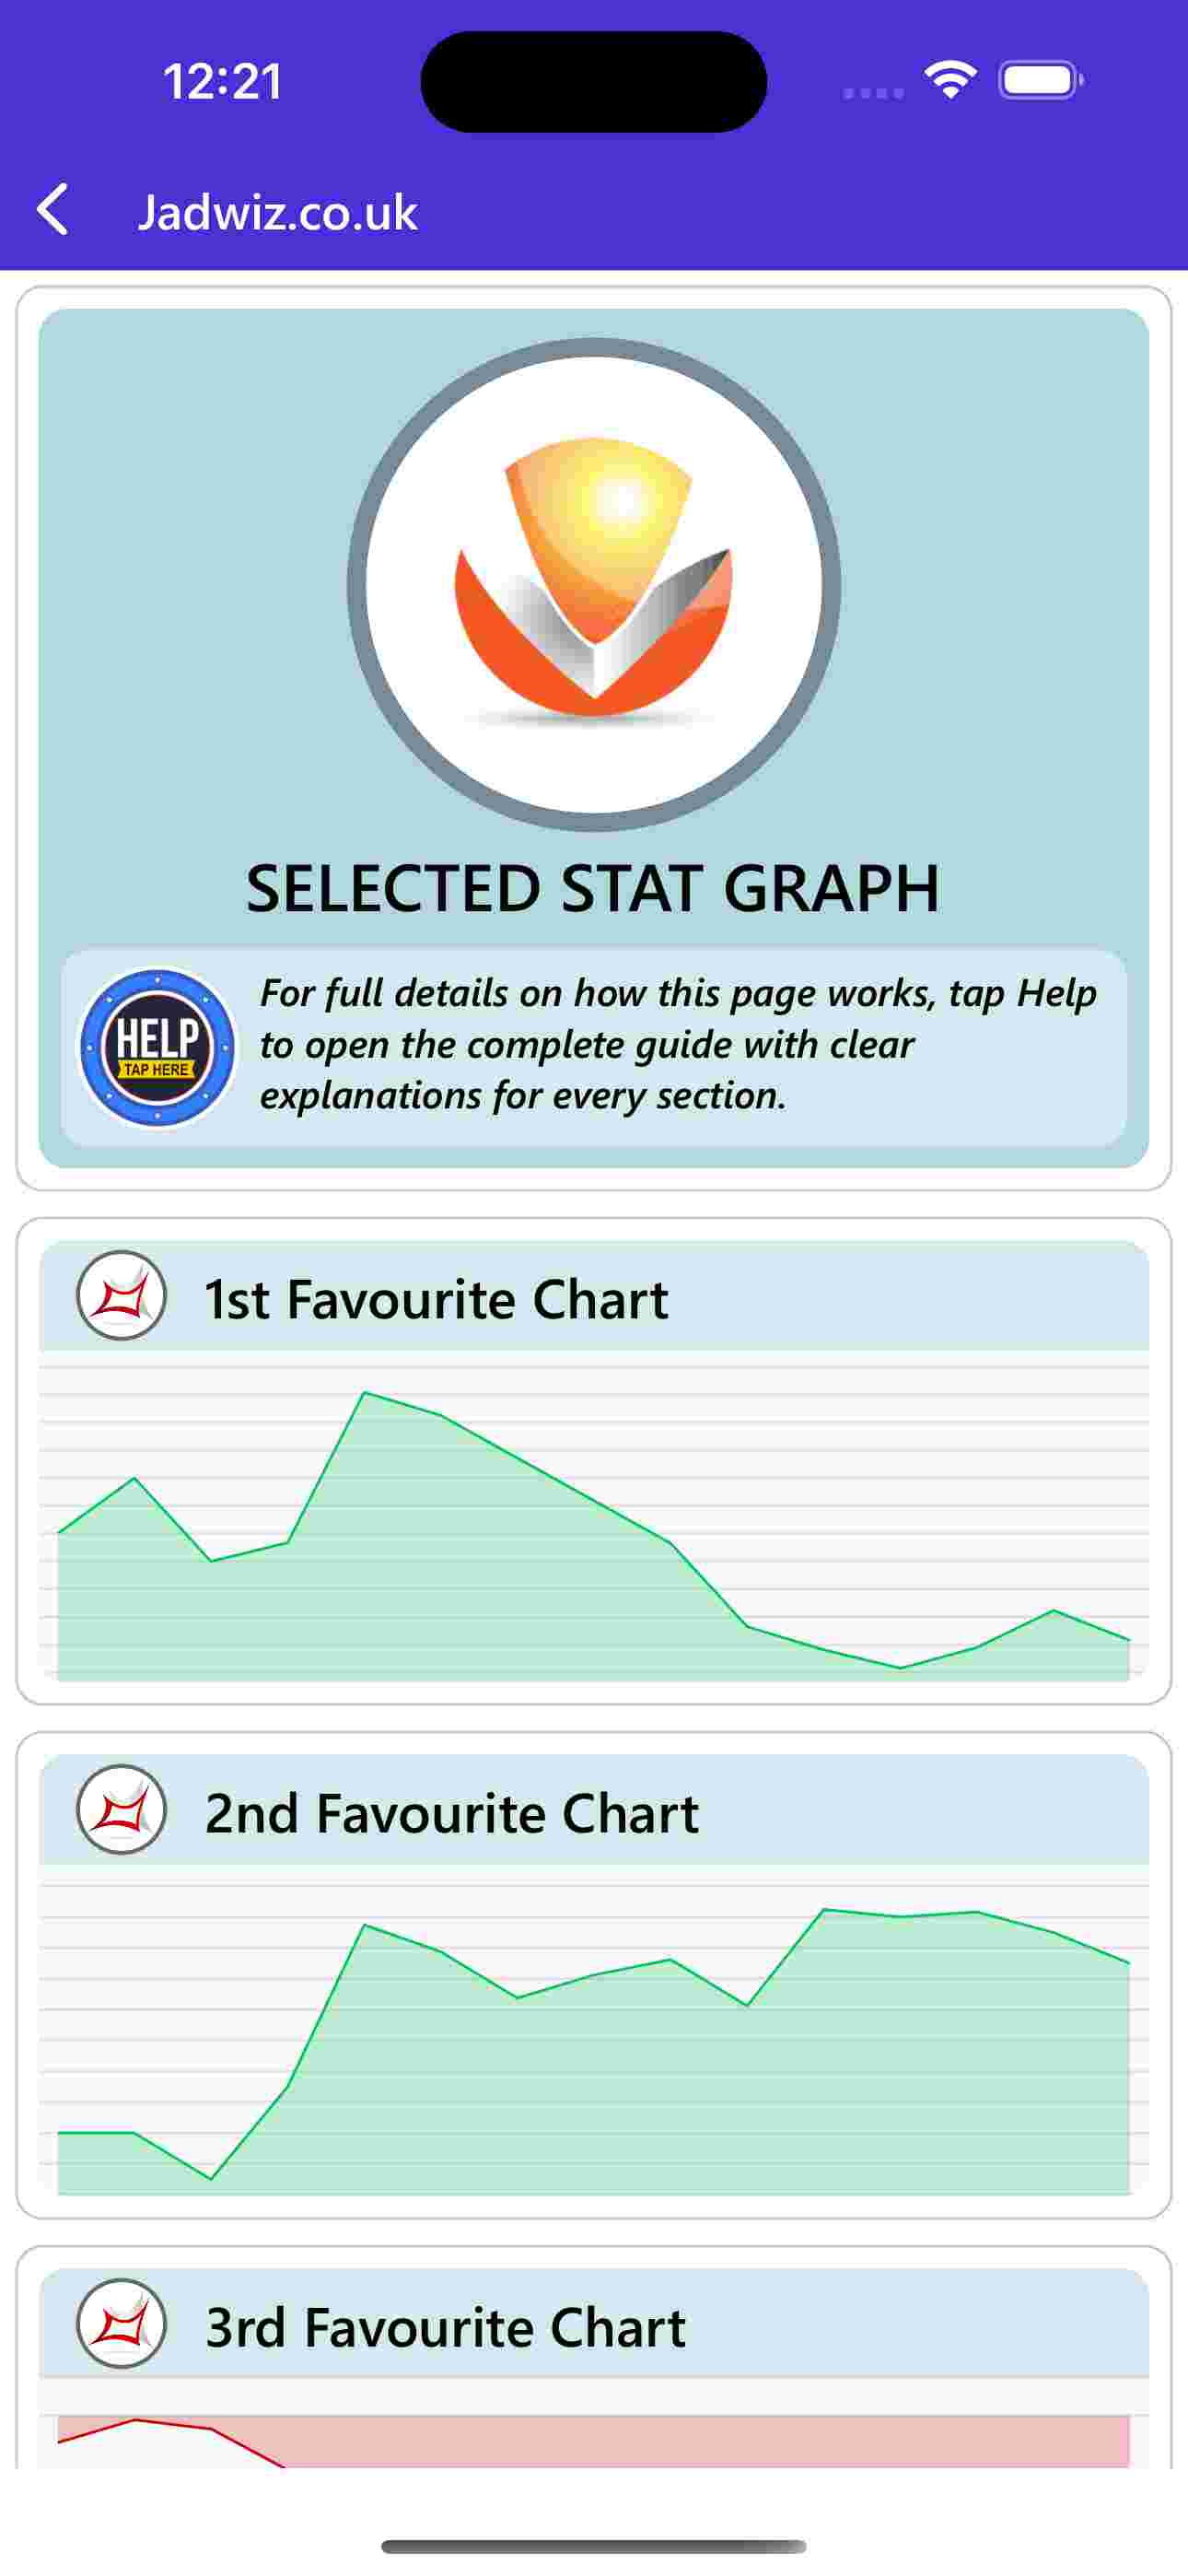
Sometimes a stat looks profitable, but the graph reveals:
- A big spike early on
- Followed by years of decline
Other times, the graph shows:
- A steady, consistent climb
- A reliable long term pattern
How to view a graph
- Tap the stat
- Scroll to the bottom
- Tap View Graph
Why graphs matter
They help you avoid:
- False positives
- Stats that only look good because of one lucky run
- Unstable patterns
And they help you find:
- Long term consistency
- Reliable angles
- Stats worth saving
The first three favourites win two‑thirds of all races. By understanding how they behave under different conditions, we can make smarter, faster decisions.

Horse Racing Favourites App
-
 Beginners Guide
for the beguiners guide click here -
 Navigating The App
for navigating the app click here -
 Understanding Favourite Stats
for understanding favourite stats click here -
 Using Filters
for using filters click here -
 Finding Your Own Stats
for finding your own stats click here -
 Saving Stats
for saving stats click here -
 My Saved Stats
for my saved stats click here -
 Premium Stats
for premium stats click here -
 Todays Favourites
for todays favourites click here -
 Positive Stats
for positive stats click here -
 Top Selections
for top selections click here -
 Using Graphs
for using graphs click here -
 Comparing Stats
for comparing stats click here -
 My App Health
for my app health click here -
 Special Offers
for special offers click here -
 Summary
for summary click here