

Horse Racing Favourites App
Understanding Favourite Stats
This is the heart of the app. When you select Favourite Stats, you’ll see a list of all UK racecourses and how the 1st, 2nd, and 3rd favourites have performed over the last 35 years.
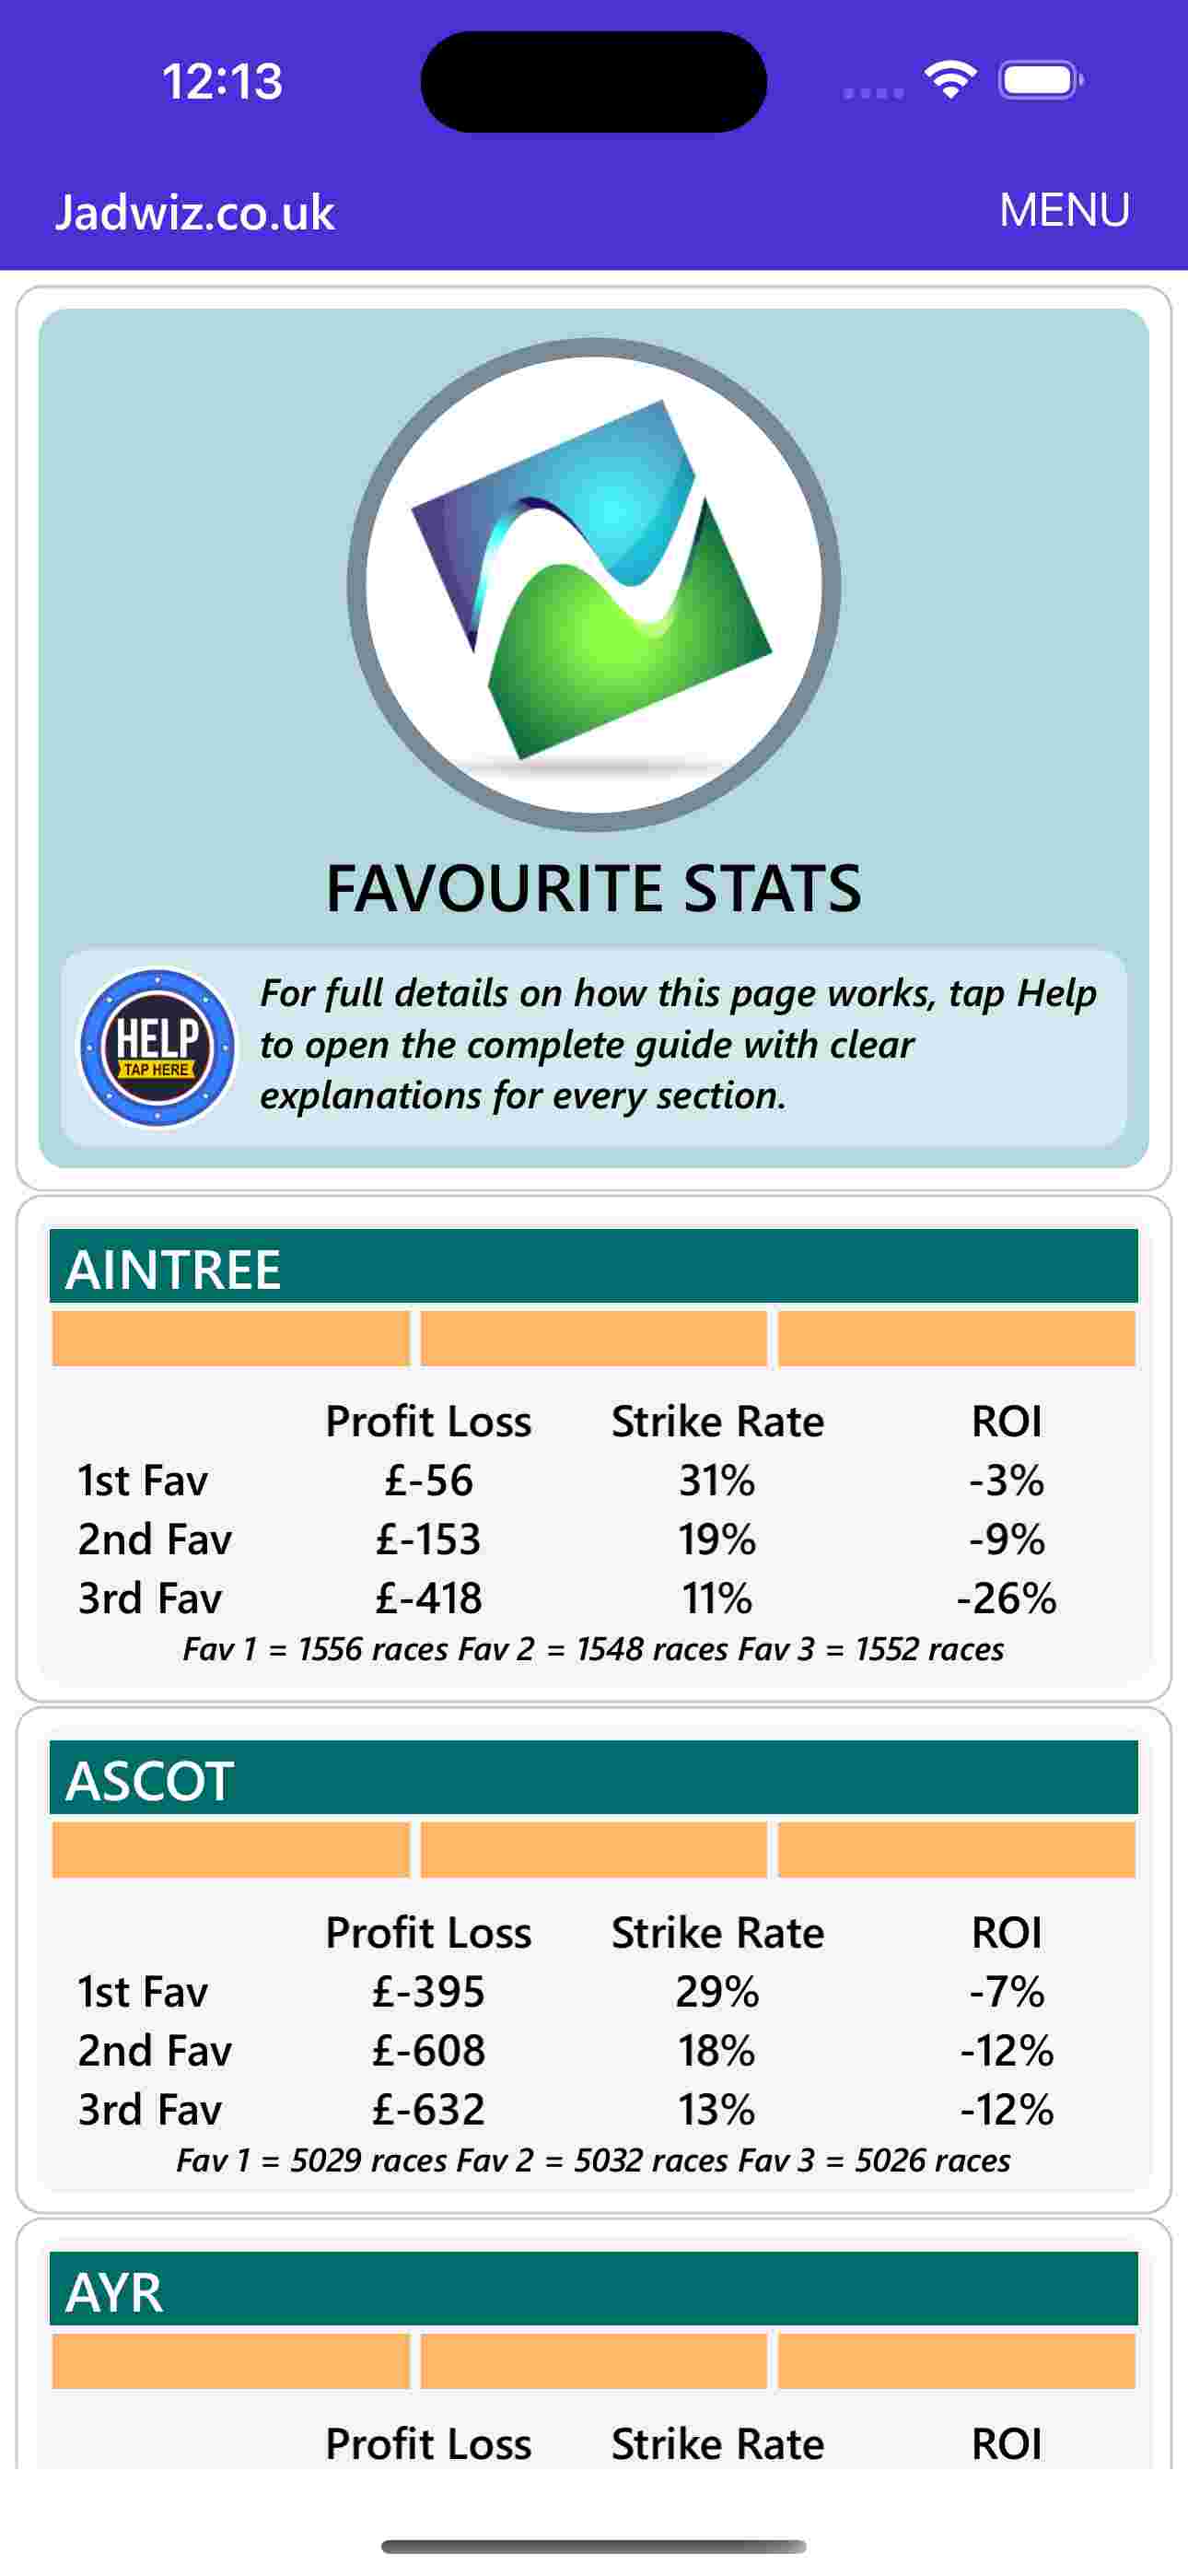
Each racecourse displays:
- Profit/Loss – total return from £1 stakes
- Strike Rate – win percentage
- ROI – percentage profit or loss
- Sample Size – number of races included
Why ROI matters
ROI is the clearest indicator of long term performance. A +20% ROI means £1 stakes returned £1.20 on average.
Why sample size matters
A stat with 35 races means roughly one race per year. It can still be useful—but larger groups are more reliable. The app helps you build those larger, stronger samples.
The first three favourites win two‑thirds of all races. By understanding how they behave under different conditions, we can make smarter, faster decisions.

Horse Racing Favourites App
-
 Beginners Guide
for the beguiners guide click here -
 Navigating The App
for navigating the app click here -
 Understanding Favourite Stats
for understanding favourite stats click here -
 Using Filters
for using filters click here -
 Finding Your Own Stats
for finding your own stats click here -
 Saving Stats
for saving stats click here -
 My Saved Stats
for my saved stats click here -
 Premium Stats
for premium stats click here -
 Todays Favourites
for todays favourites click here -
 Positive Stats
for positive stats click here -
 Top Selections
for top selections click here -
 Using Graphs
for using graphs click here -
 Comparing Stats
for comparing stats click here -
 My App Health
for my app health click here -
 Special Offers
for special offers click here -
 Summary
for summary click here