

Welcome to Jadwiz Favourites
Welcome to Jadwiz Favourites, your guide to understanding how the first three favourites have performed at every UK racecourse over the last 35 years.
The app gives us two powerful ways to work:
Free Method
We explore racecourse stats, apply filters, and save our own profitable angles.
Premium Method
We unlock Premium Stats or Today’s Favourites for instant, curated insights.
Starter Stats are included automatically the first time we open My Stats.
Navigating the app
The main menu is where everything begins. To open it, select MENU at the top right of the screen.
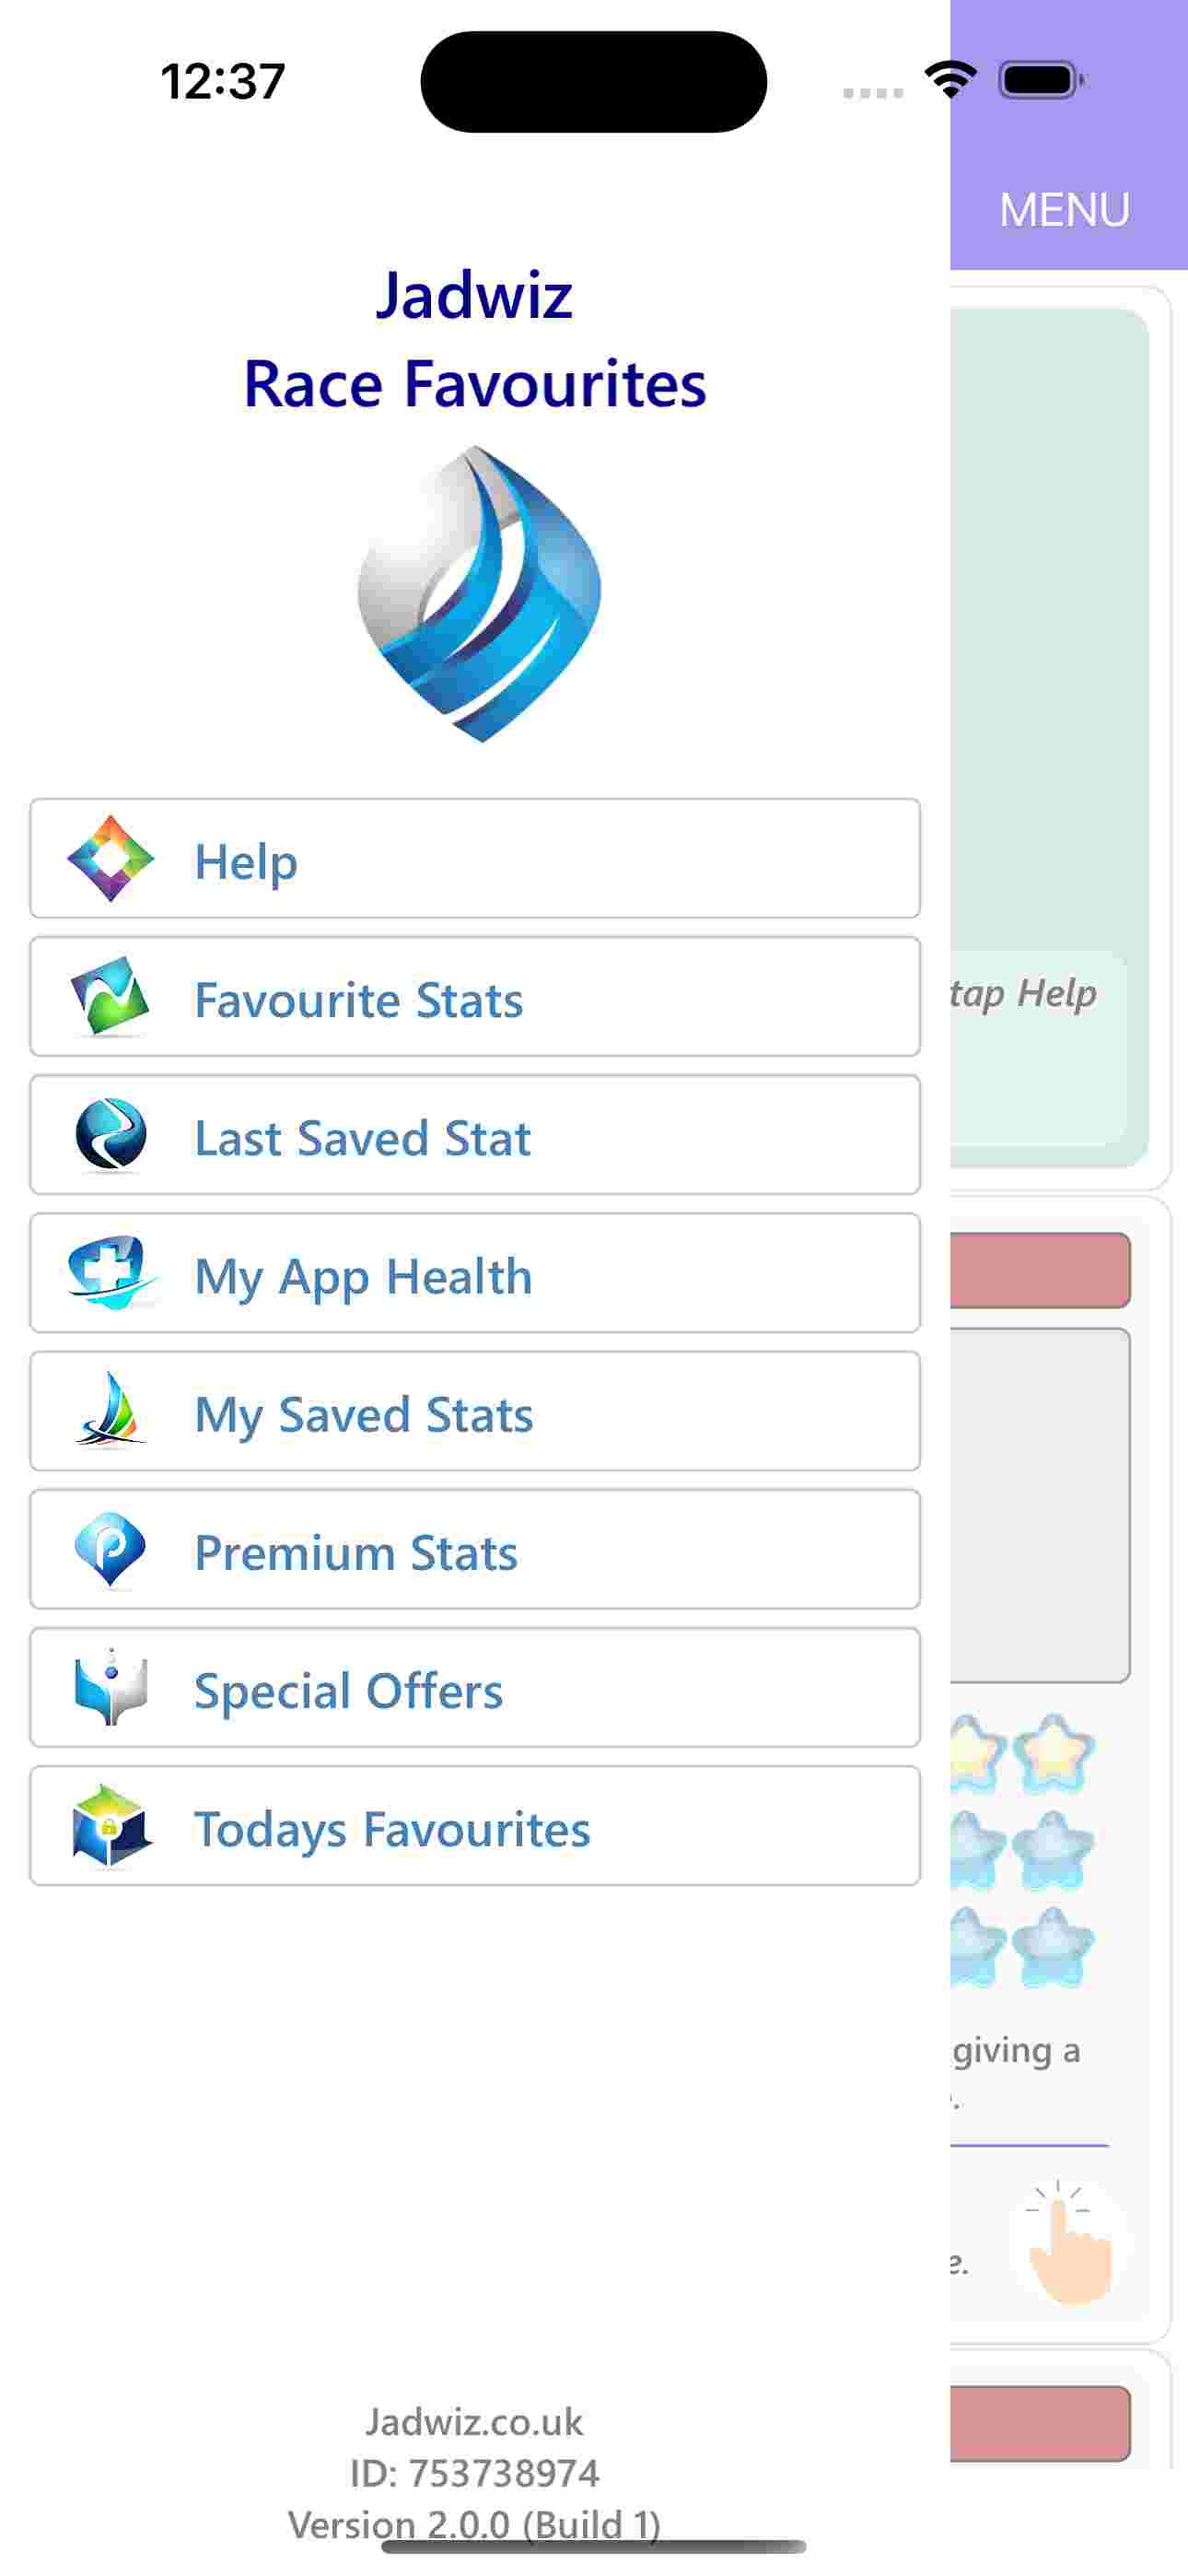
From here, you’ll find:
- Favourite Stats – explore long term performance for every racecourse
- My Saved Stats – view your saved and premium stats
- Today’s Favourites – premium race day ratings
- Search All Racecourse Stats – systematic stat discovery
- My App Health – check unlocks, databases, and app status
- Special Offers – discounts and promo codes
- Quick Start Guide – fast onboarding
- Help Icons – available on every page
Understanding Favourite Stats
This is the heart of the app. When you select Favourite Stats, you’ll see a list of all UK racecourses and how the 1st, 2nd, and 3rd favourites have performed over the last 35 years.
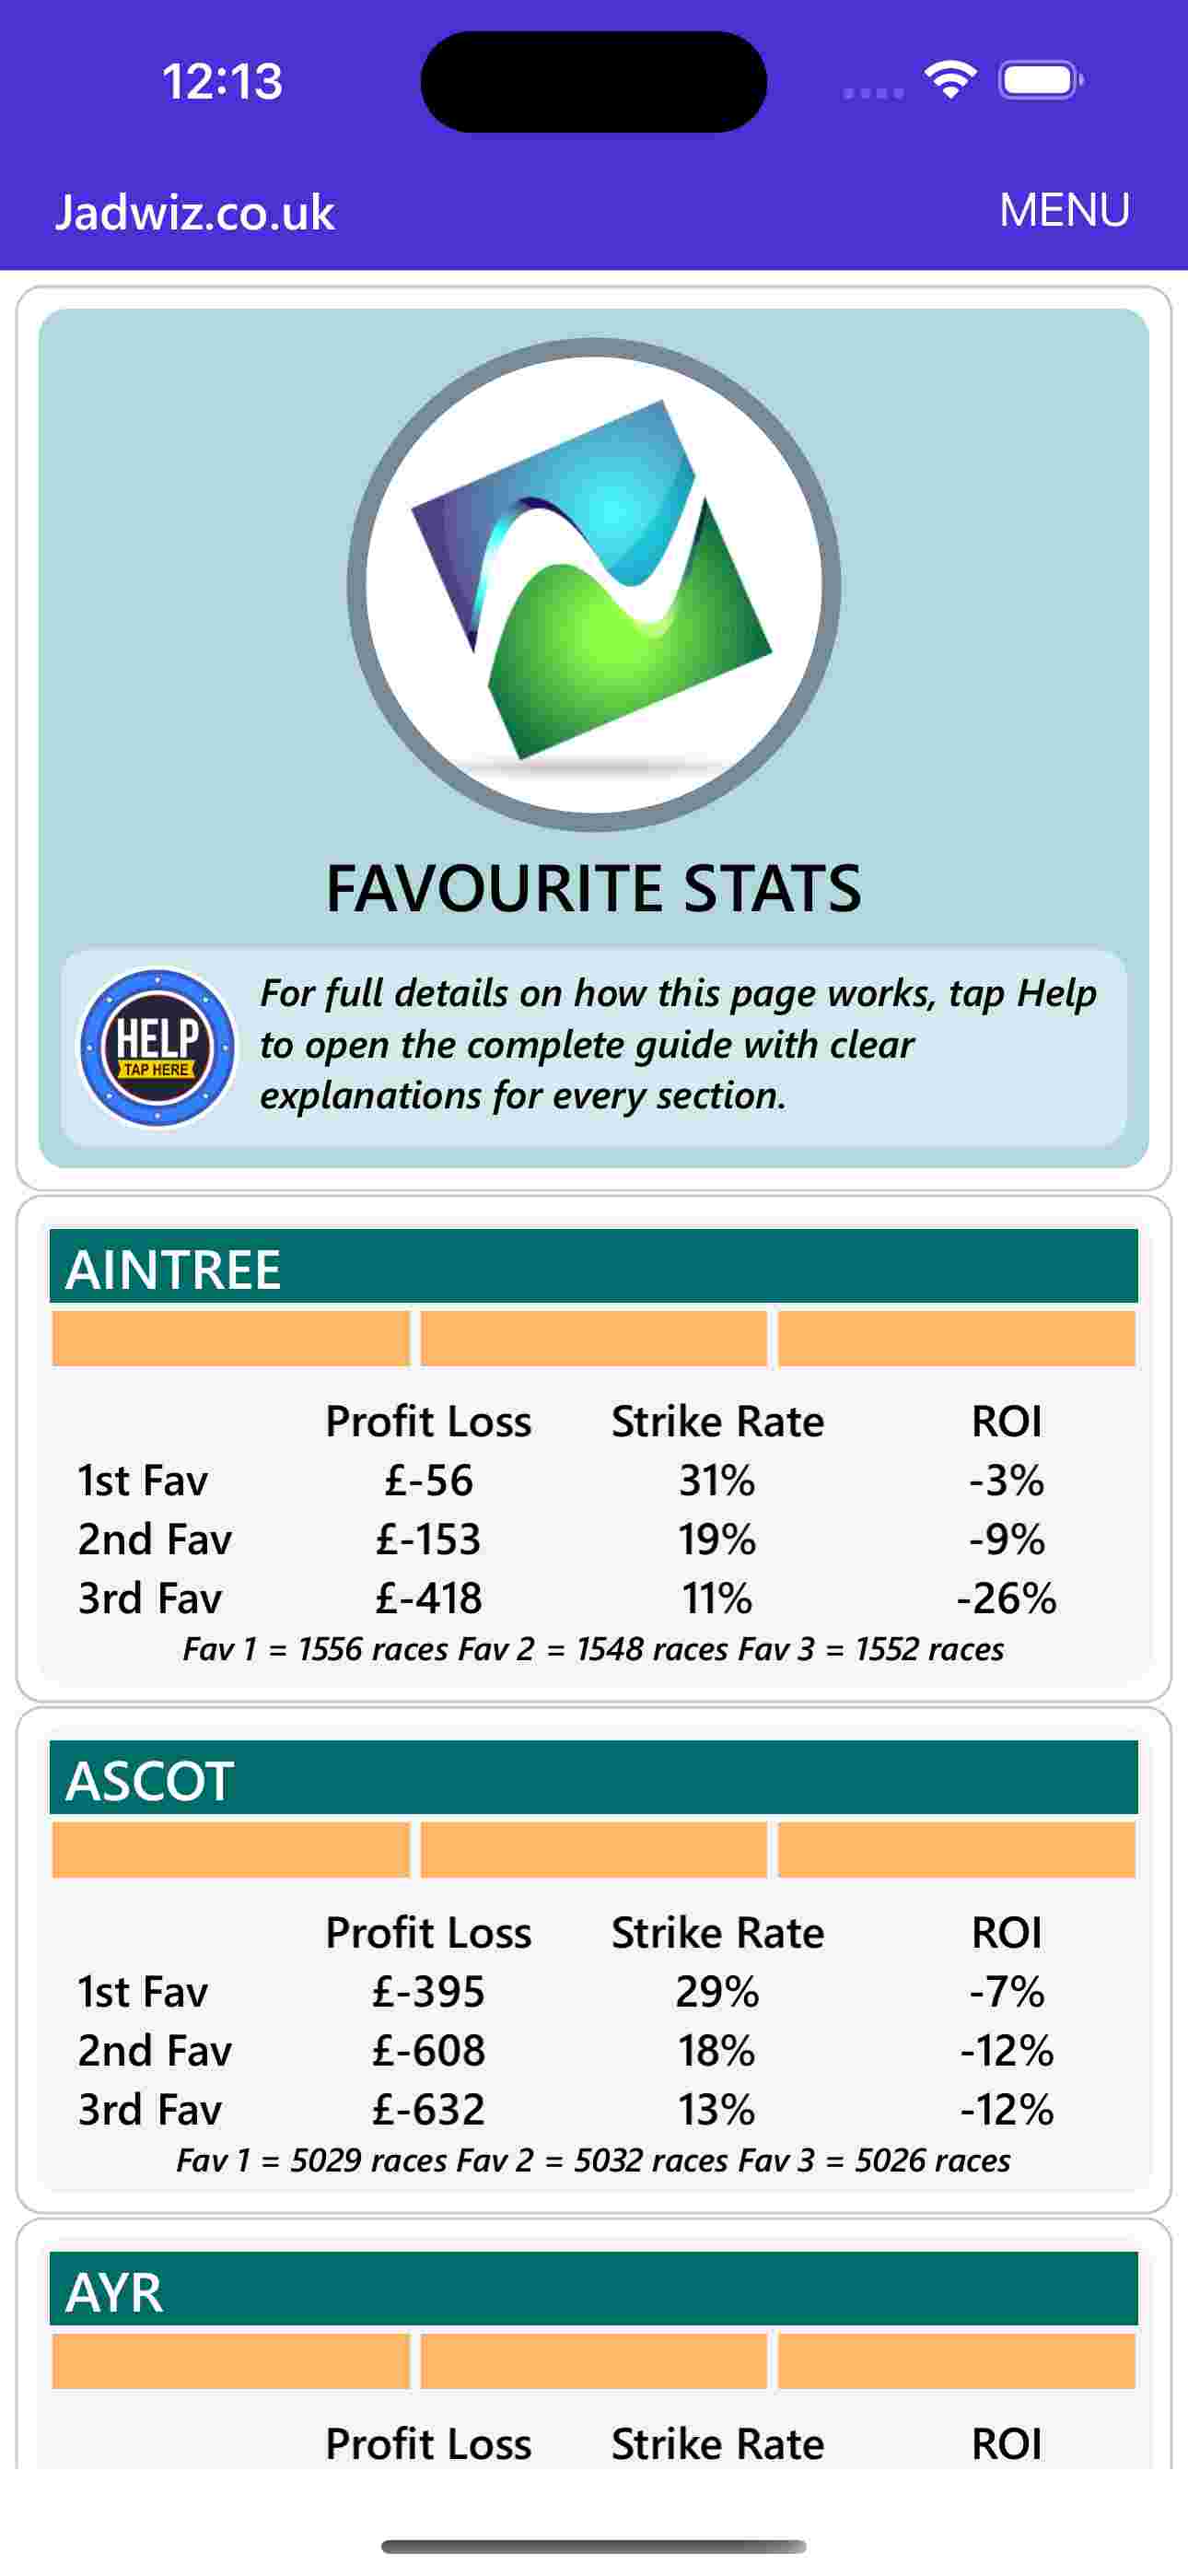
Each racecourse displays:
- Profit/Loss – total return from £1 stakes
- Strike Rate – win percentage
- ROI – percentage profit or loss
- Sample Size – number of races included
Why ROI matters
ROI is the clearest indicator of long term performance. A +20% ROI means £1 stakes returned £1.20 on average.
Why sample size matters
A stat with 35 races means roughly one race per year. It can still be useful—but larger groups are more reliable. The app helps you build those larger, stronger samples.
Using filters
Filters are where the app becomes powerful. They allow you to narrow results and uncover long term profitable angles hidden inside decades of racing history.
To open the filters, tap any racecourse on the main stats page.
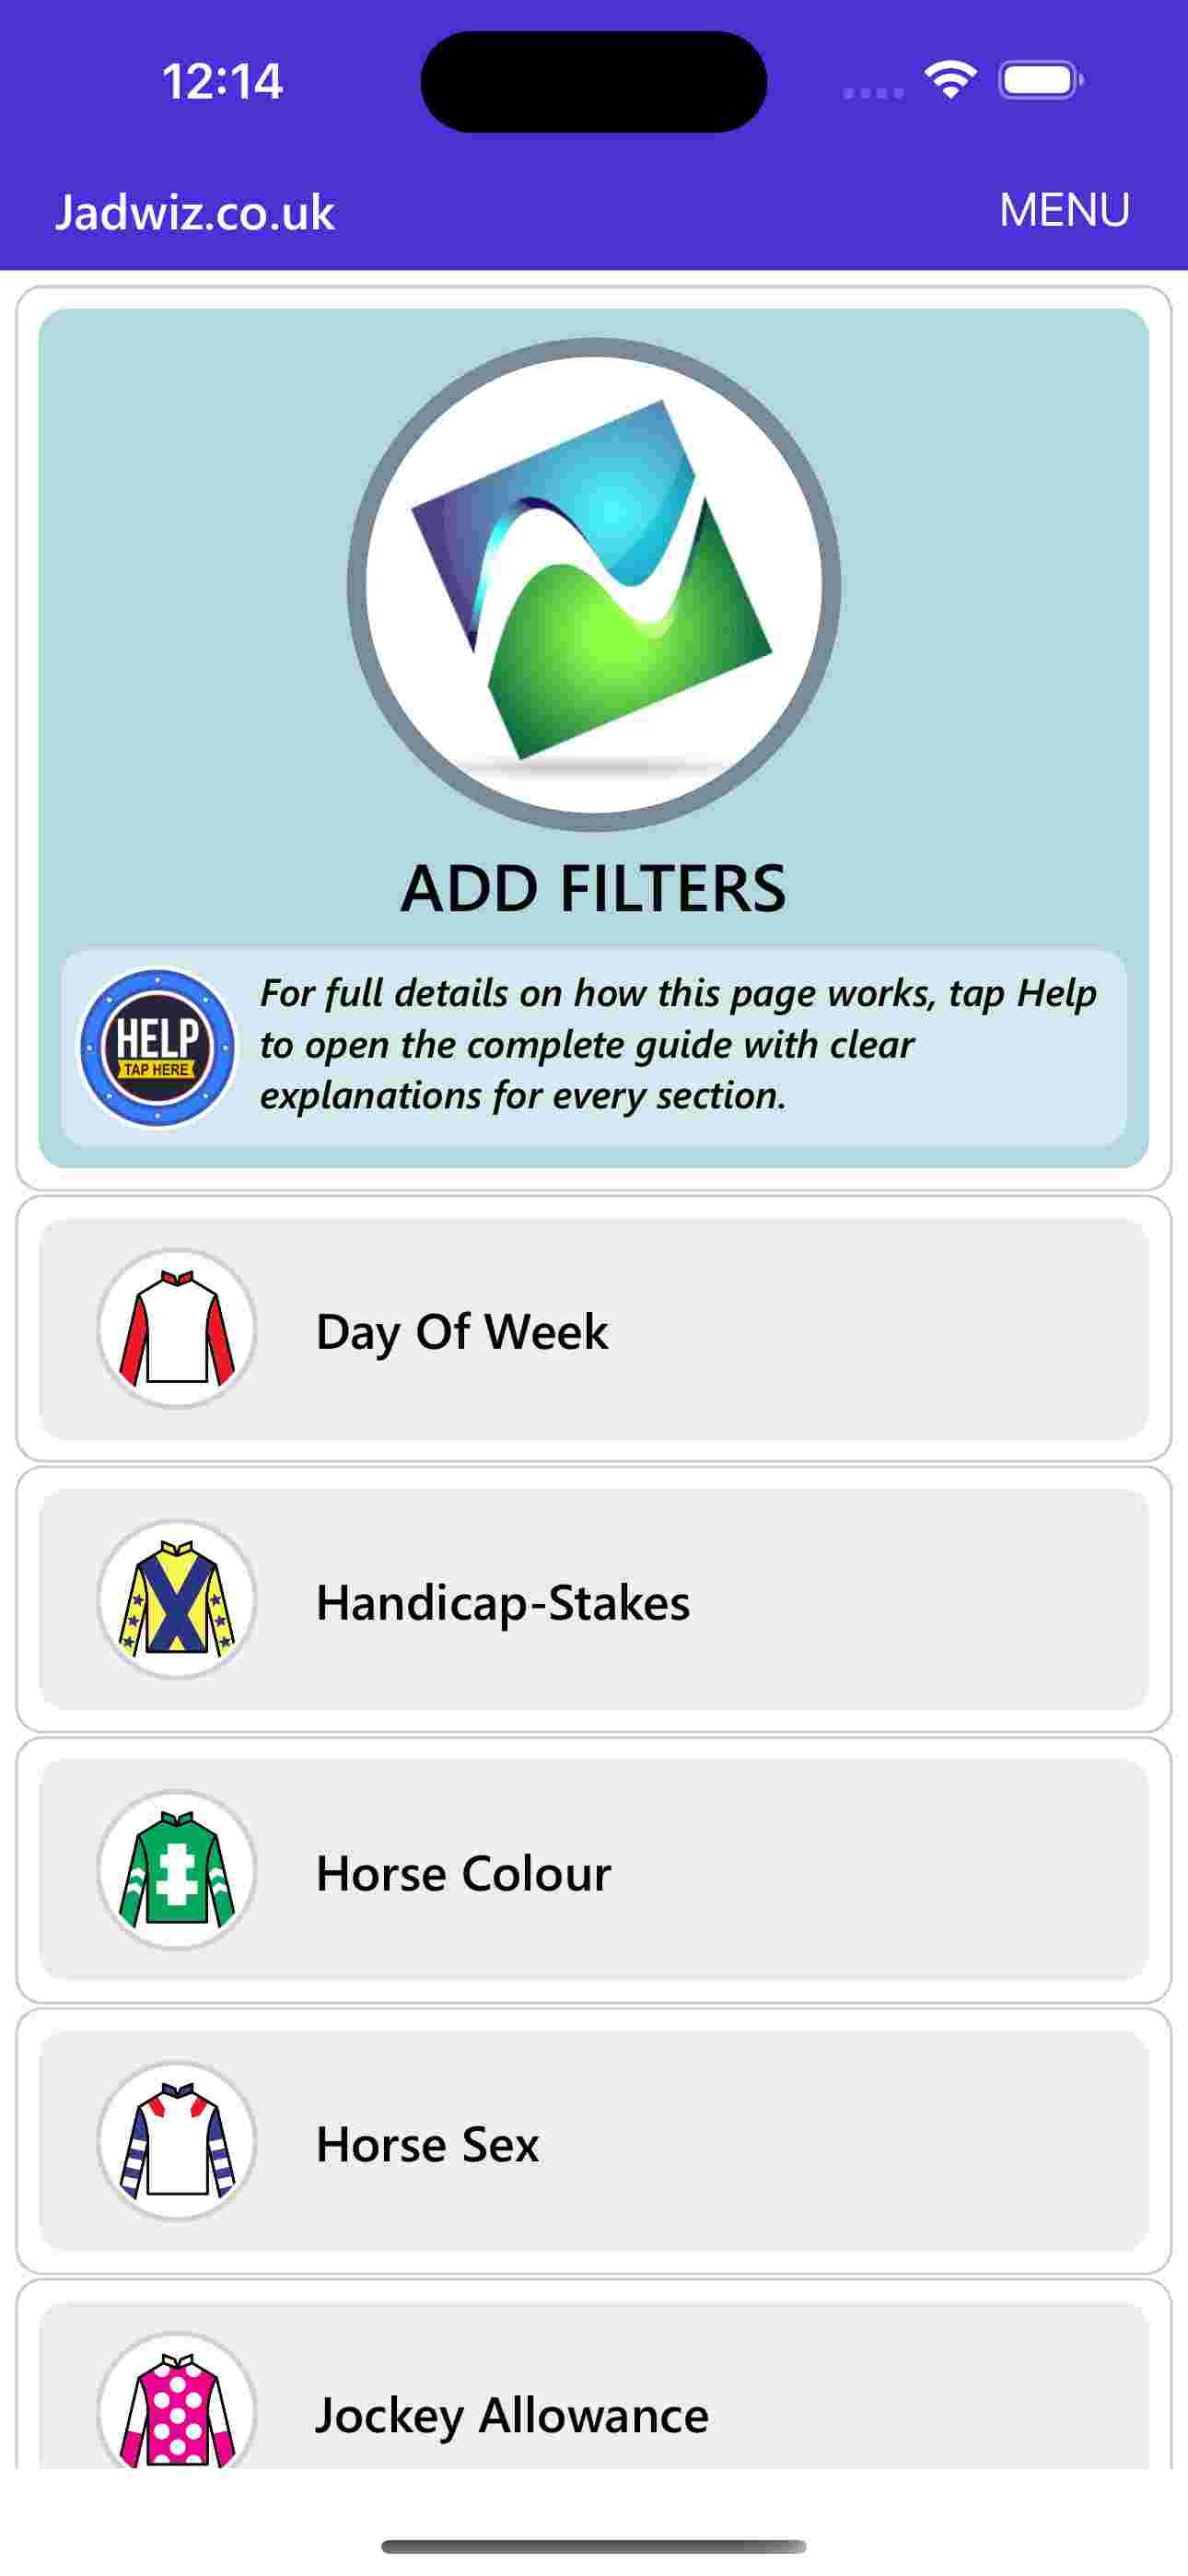
You’ll see the full list of available filters:
- Day of Week
- Handicap / Stakes
- Horse Colour
- Horse Sex
- Jockey Allowance
- Month of Year
- Prize Money
- Race Type
- Race Class
- Race Distance
- Weight
How filters work
When you select a filter, the app splits the results into groups. For example, choosing Day of Week shows how favourites have performed on:
- Sunday
- Monday
- Tuesday
- …and so on
Each group displays Profit/Loss, Strike Rate, and ROI.
Add vs Swap
When you choose a second or third filter, the app asks:
- Add Filter – keep the previous filters and add this one
- Swap Filter – replace the last filter with the new one
Add helps you drill deeper. Swap helps you explore alternatives quickly.
Maximum of three filters
You can apply up to three filters at once. If you try to add a fourth, the app will ask you to swap instead—because the sample group would become too small.
Best practice: Always start with Day of Week
Starting with Day of Week keeps everything organised and makes saving stats far easier later.
Finding your own stats (Free Method)
If you want to use the app for free, this is where you build your own stat library. The key is a simple, repeatable routine so you never lose track of where you’re up to.
Step 1 — Choose a racecourse
For example, select Newmarket.
Step 2 — Add the first filter: Day of Week
This splits the results into Sunday, Monday, Tuesday, etc.
Step 3 — Choose a day and add a second filter

For example:
- Day of Week = Sunday
- Add filter = Handicap / Stakes
Now you see how favourites perform in Sunday handicaps or non‑handicaps.
Step 4 — Add a third filter
This is where you often find the strongest stats. For example:
- Day of Week = Sunday
- Handicap / Stakes = Handicap
- Horse Colour = Chestnut
If the ROI is strong and the sample size is reasonable (35+ races is recommended), this is a stat worth saving.
Step 5 — Save the stat
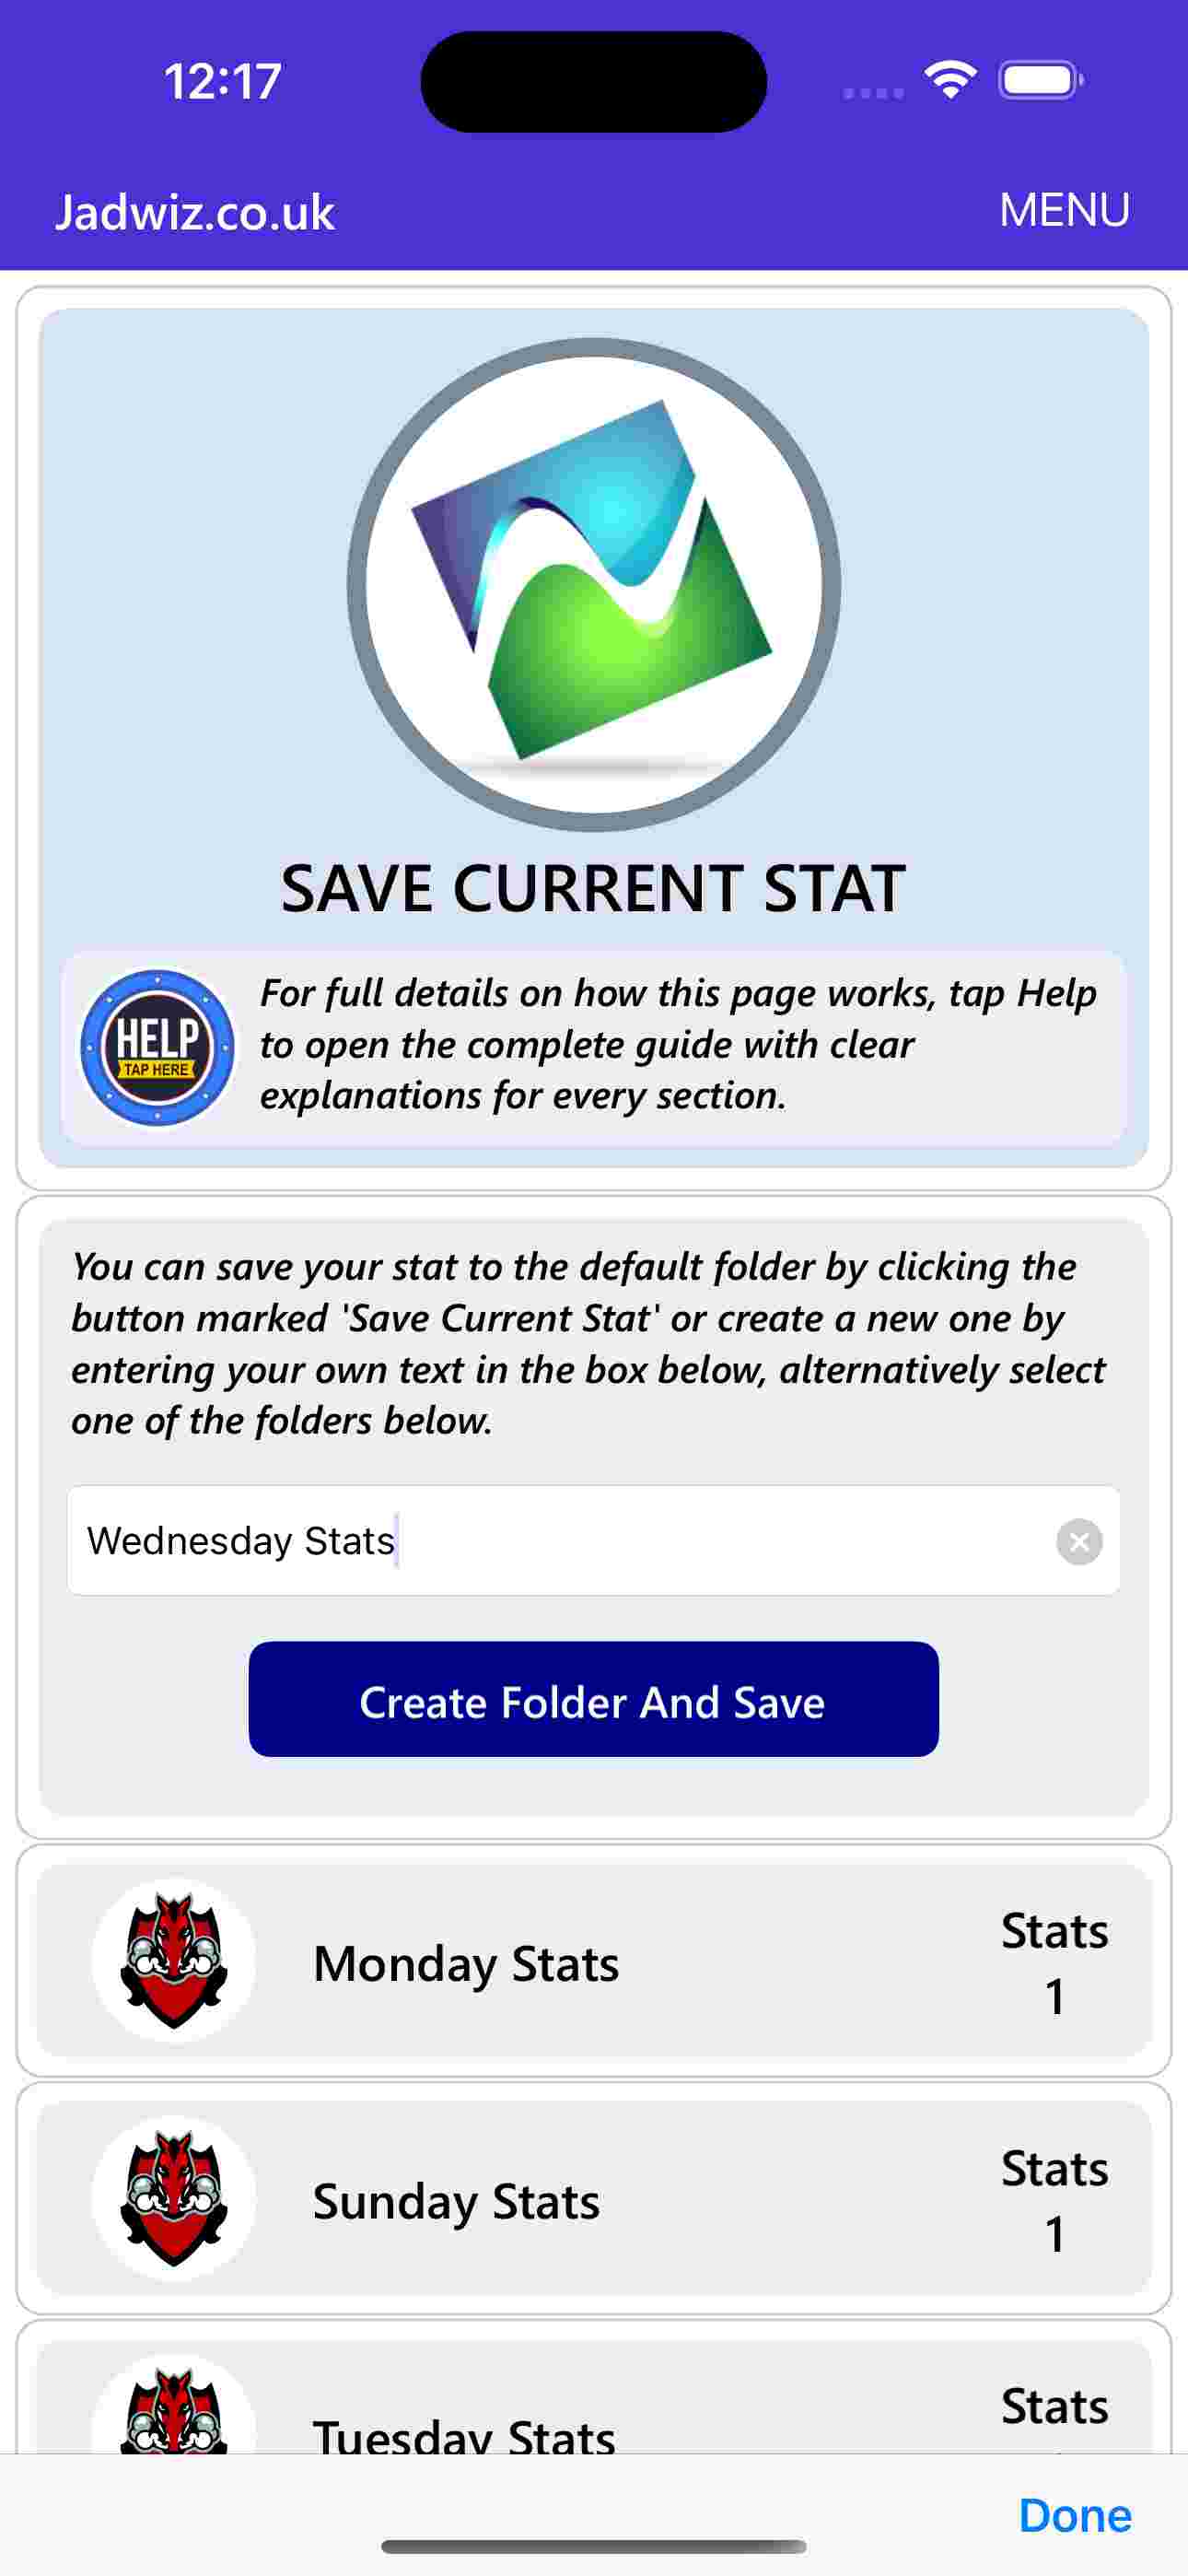
Once you find a stat you like, tap it and scroll to the bottom of the filters page, then tap Save.
Step 6 — Continue systematically
After saving:
- Move to the next filter
- Swap the last filter
- Repeat until all filters have been used
This method ensures you never miss a profitable stat.
Saving stats
When you save a stat, you can:
- Save to an existing folder
- Create a new folder
- Use the default My General Stats folder
The best method: Create folders by day of the week
This keeps everything organised. For example:
- Save Sunday stats in a folder called Sunday
- Save Monday stats in a folder called Monday
- …and so on
Then, when racing is taking place on a Thursday, you only check the Thursday folder—not 70 mixed stats.
My Saved Stats
My Saved Stats is where all your saved stats—and your Premium Stats—are stored.
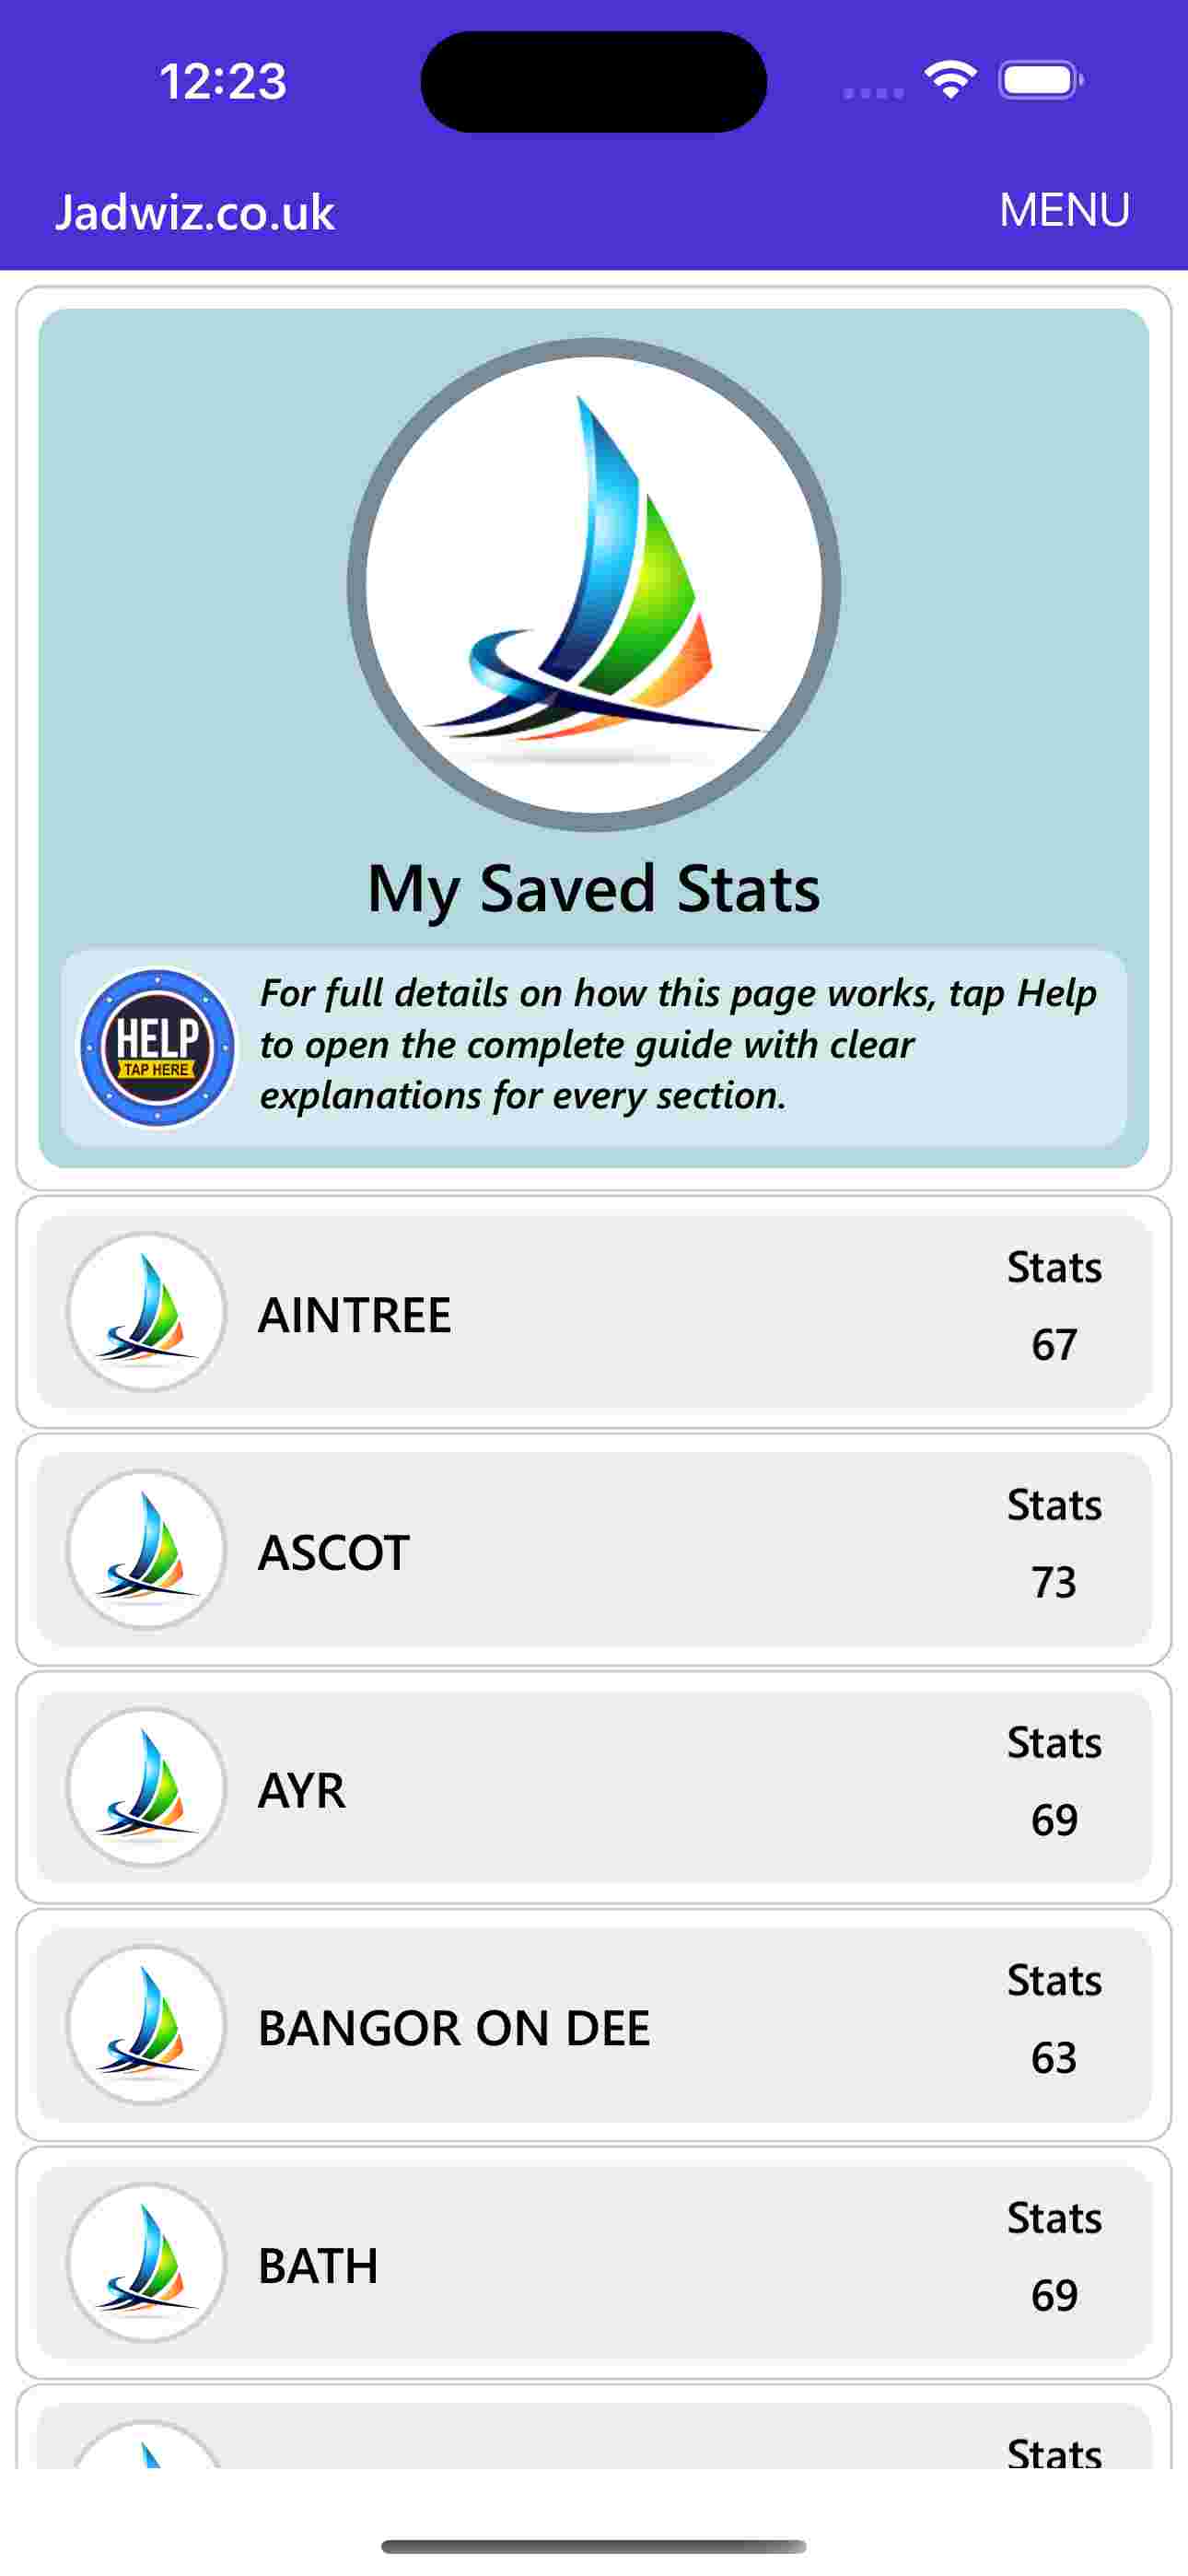
When you open My Saved Stats, you’ll see:
- A list of racecourses
- A number showing how many stats you’ve saved for each
Tap a racecourse to see its folders:
- My Stats Folder
- Premium Stats
- Any custom folders you created
Tap a folder to view the stats inside.
Deleting stats
Tap a stat → Delete. If it’s the last stat in the folder, the folder disappears. This area is simple, clean, and designed to keep everything organised.
Premium Stats
Premium Stats give you a deeper, faster way to understand long term performance at every UK racecourse. Each course contains 50 curated stats, grouped by day of the week, making it incredibly easy to find what matters today.
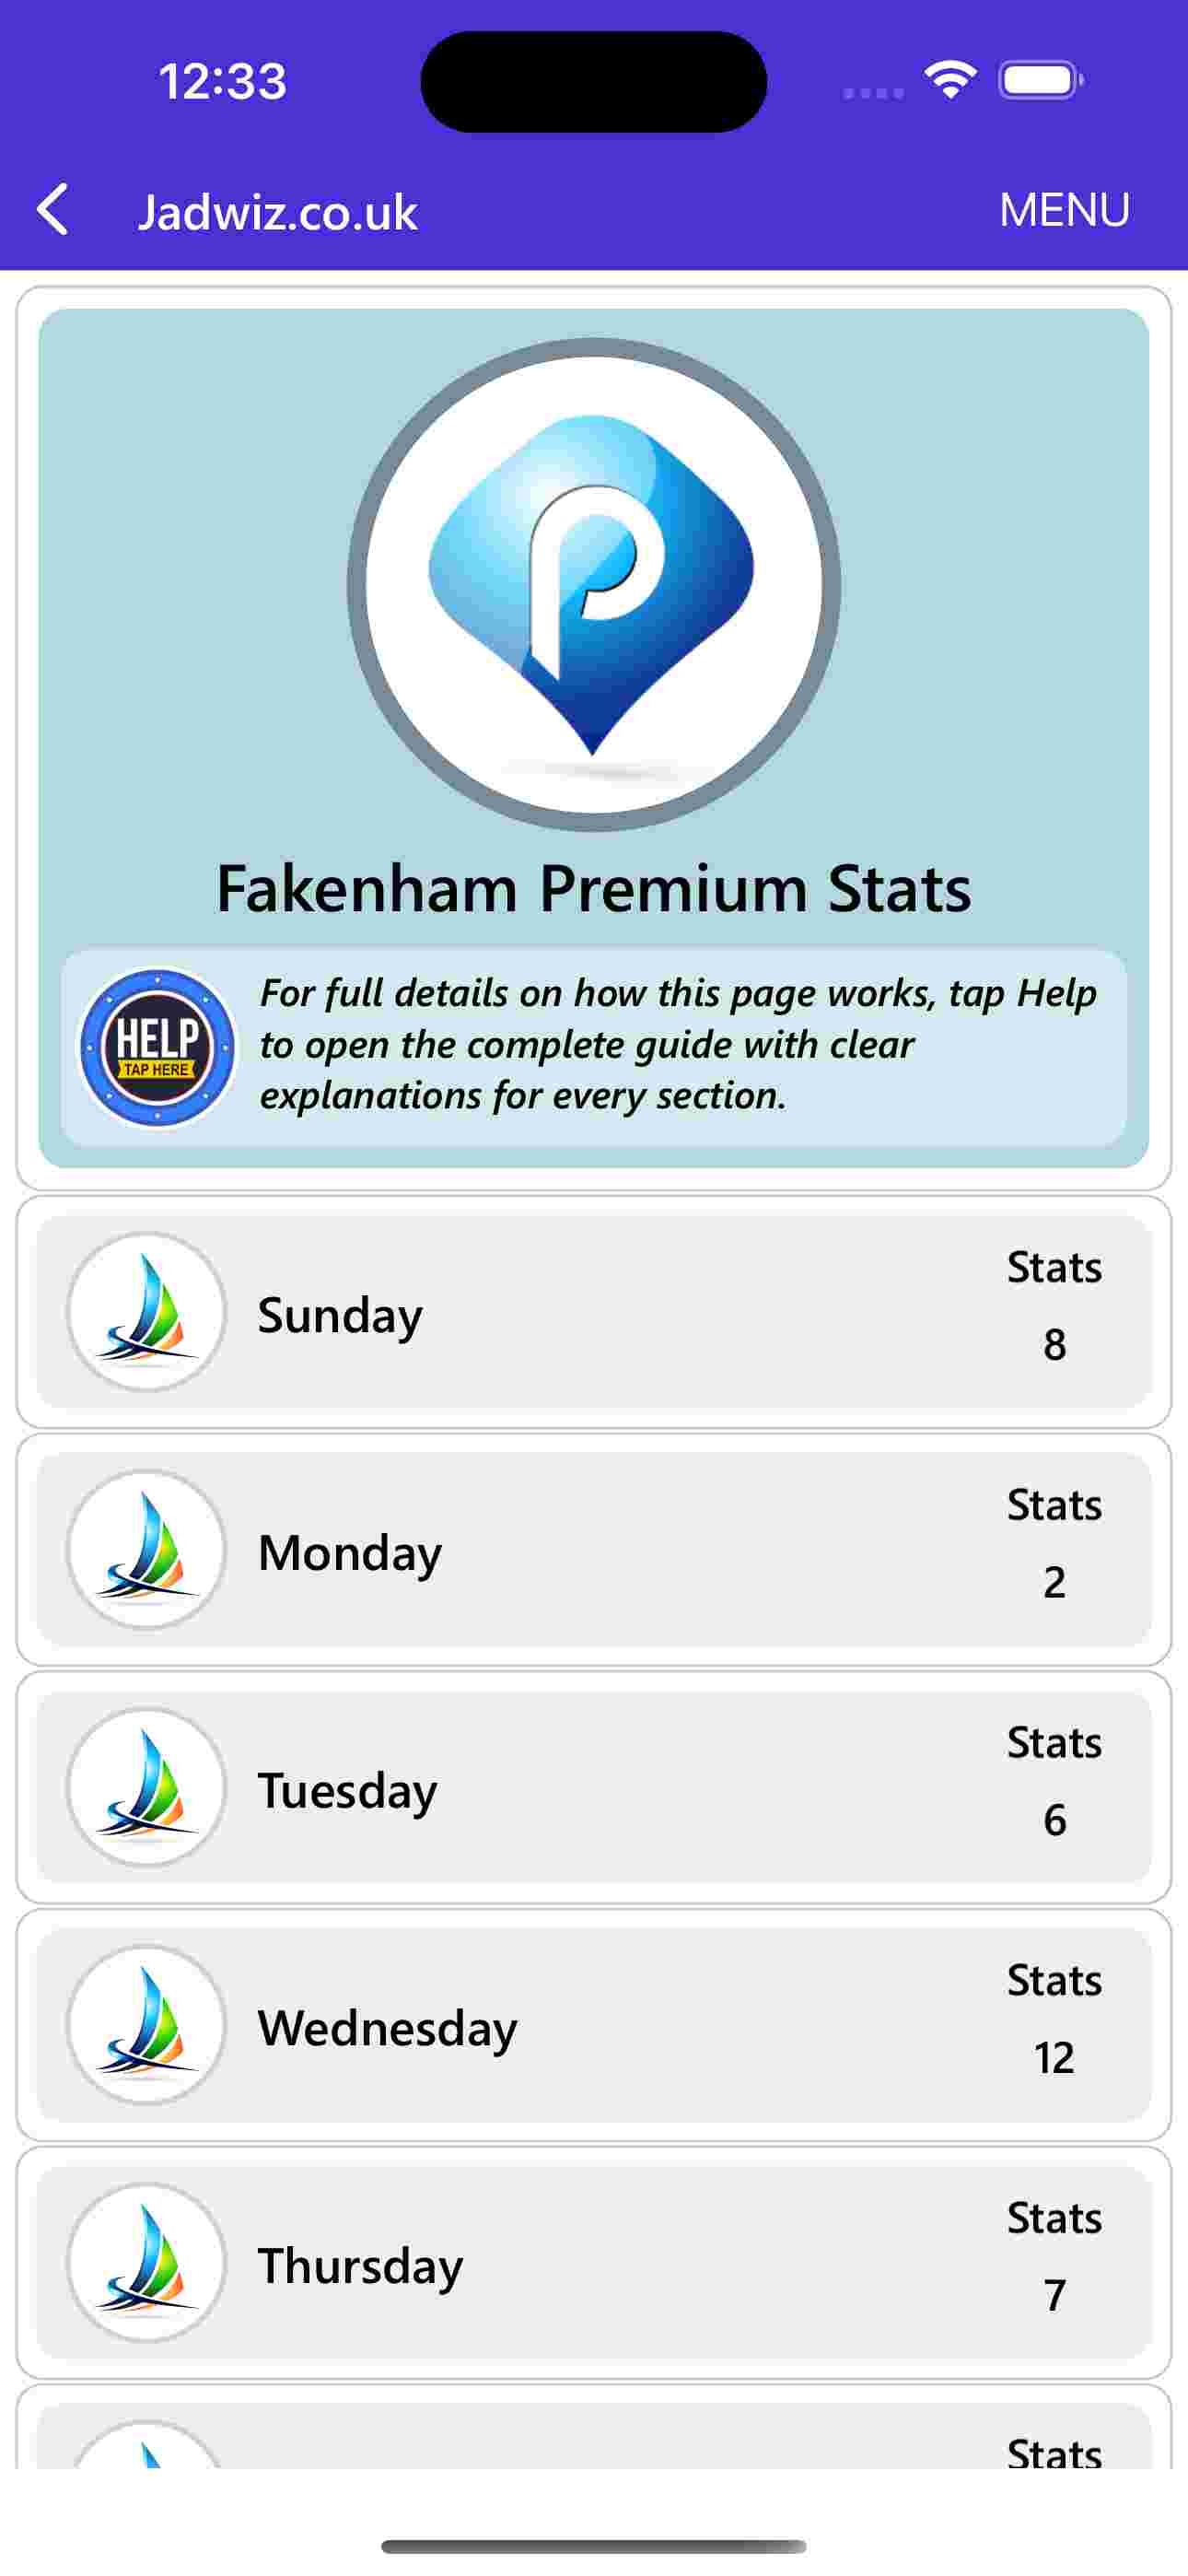
What makes Premium Stats special
Each stat:
- Uses 30–40 years of results
- Has a minimum of 35 races
- Shows ROI, strike rate, and profit/loss
- Includes a colour‑coded graph
This gives you a clear, reliable picture of long term performance.
Unlocking Premium Stats
There are two ways to unlock them:
- Pay £2.99 per racecourse – instant unlock, perfect if you want everything now.
- Unlock for free – watch a short slideshow of the course’s Premium Stats. Once the slideshow finishes, the course unlocks permanently.
You can unlock up to six courses for free, plus bonus tokens along the way.
Using Premium Stats each day
A simple daily routine:
- Open My Saved Stats
- Select the racecourse
- Tap Premium Stats
- Open the folder for today’s day of the week
- Check if any stats match today’s races
This takes less than two minutes and gives you reliable, long term angles instantly.
Today’s Favourites (Paid Feature)
Today’s Favourites is the race day engine—designed for users who want fast, accurate insights just before the off.
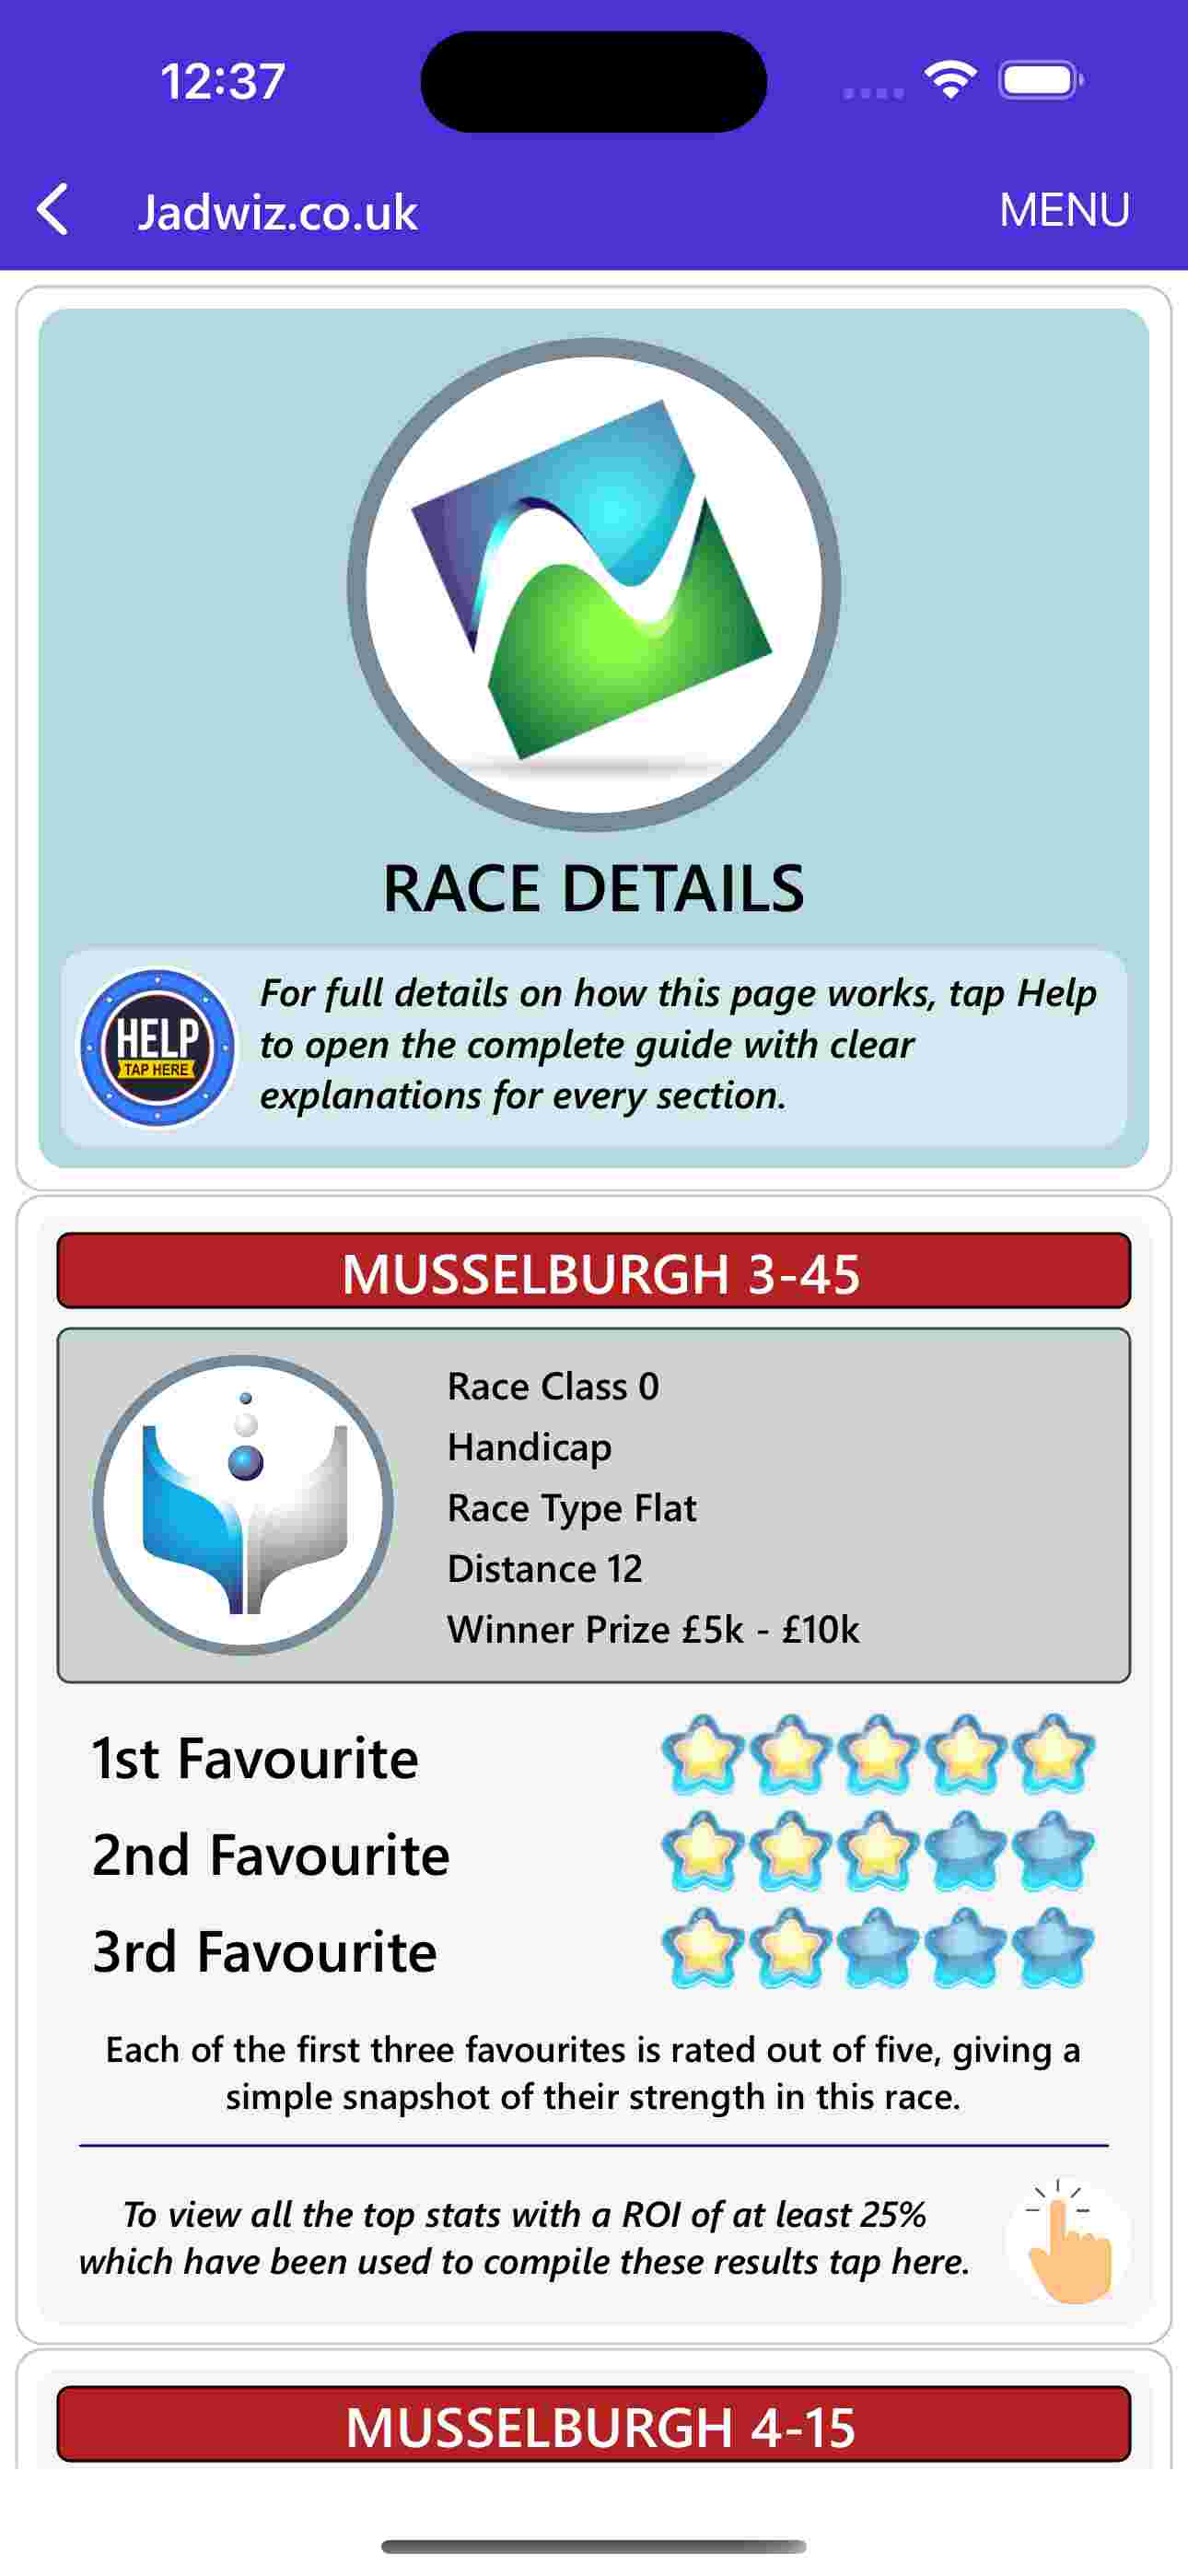
Each race displays:
- The 1st, 2nd, and 3rd favourite
- Their rating (Excellent → Poor)
- A breakdown of positive stats
How the ratings work
The app analyses over 2,000 combinations for each race, including:
- Day of week
- Race class
- Prize money
- Distance
- Race type
- Month
- And more
Each favourite receives:
- 1 star – Poor
- 2 stars – Below Average
- 3 stars – Average
- 4 stars – Above Average
- 5 stars – Excellent
The higher the rating, the stronger the long term performance under today’s conditions.
When to use Today’s Favourites
This feature is designed for:
- Race day
- Last minute decisions
- Users at the track
- Users who bet close to the off
If you place bets early in the morning, this may not be ideal—however most bookmakers take bets on the first two unnamed favourites, so it can still be incredibly powerful.
Demo file included
You can explore an older Today’s Favourites file for free before purchasing, to see:
- Ratings
- Positive Stats
- Top Selections
- Favourites Conclusion
Positive Stats
Positive Stats are the strongest individual stats behind each favourite’s rating.
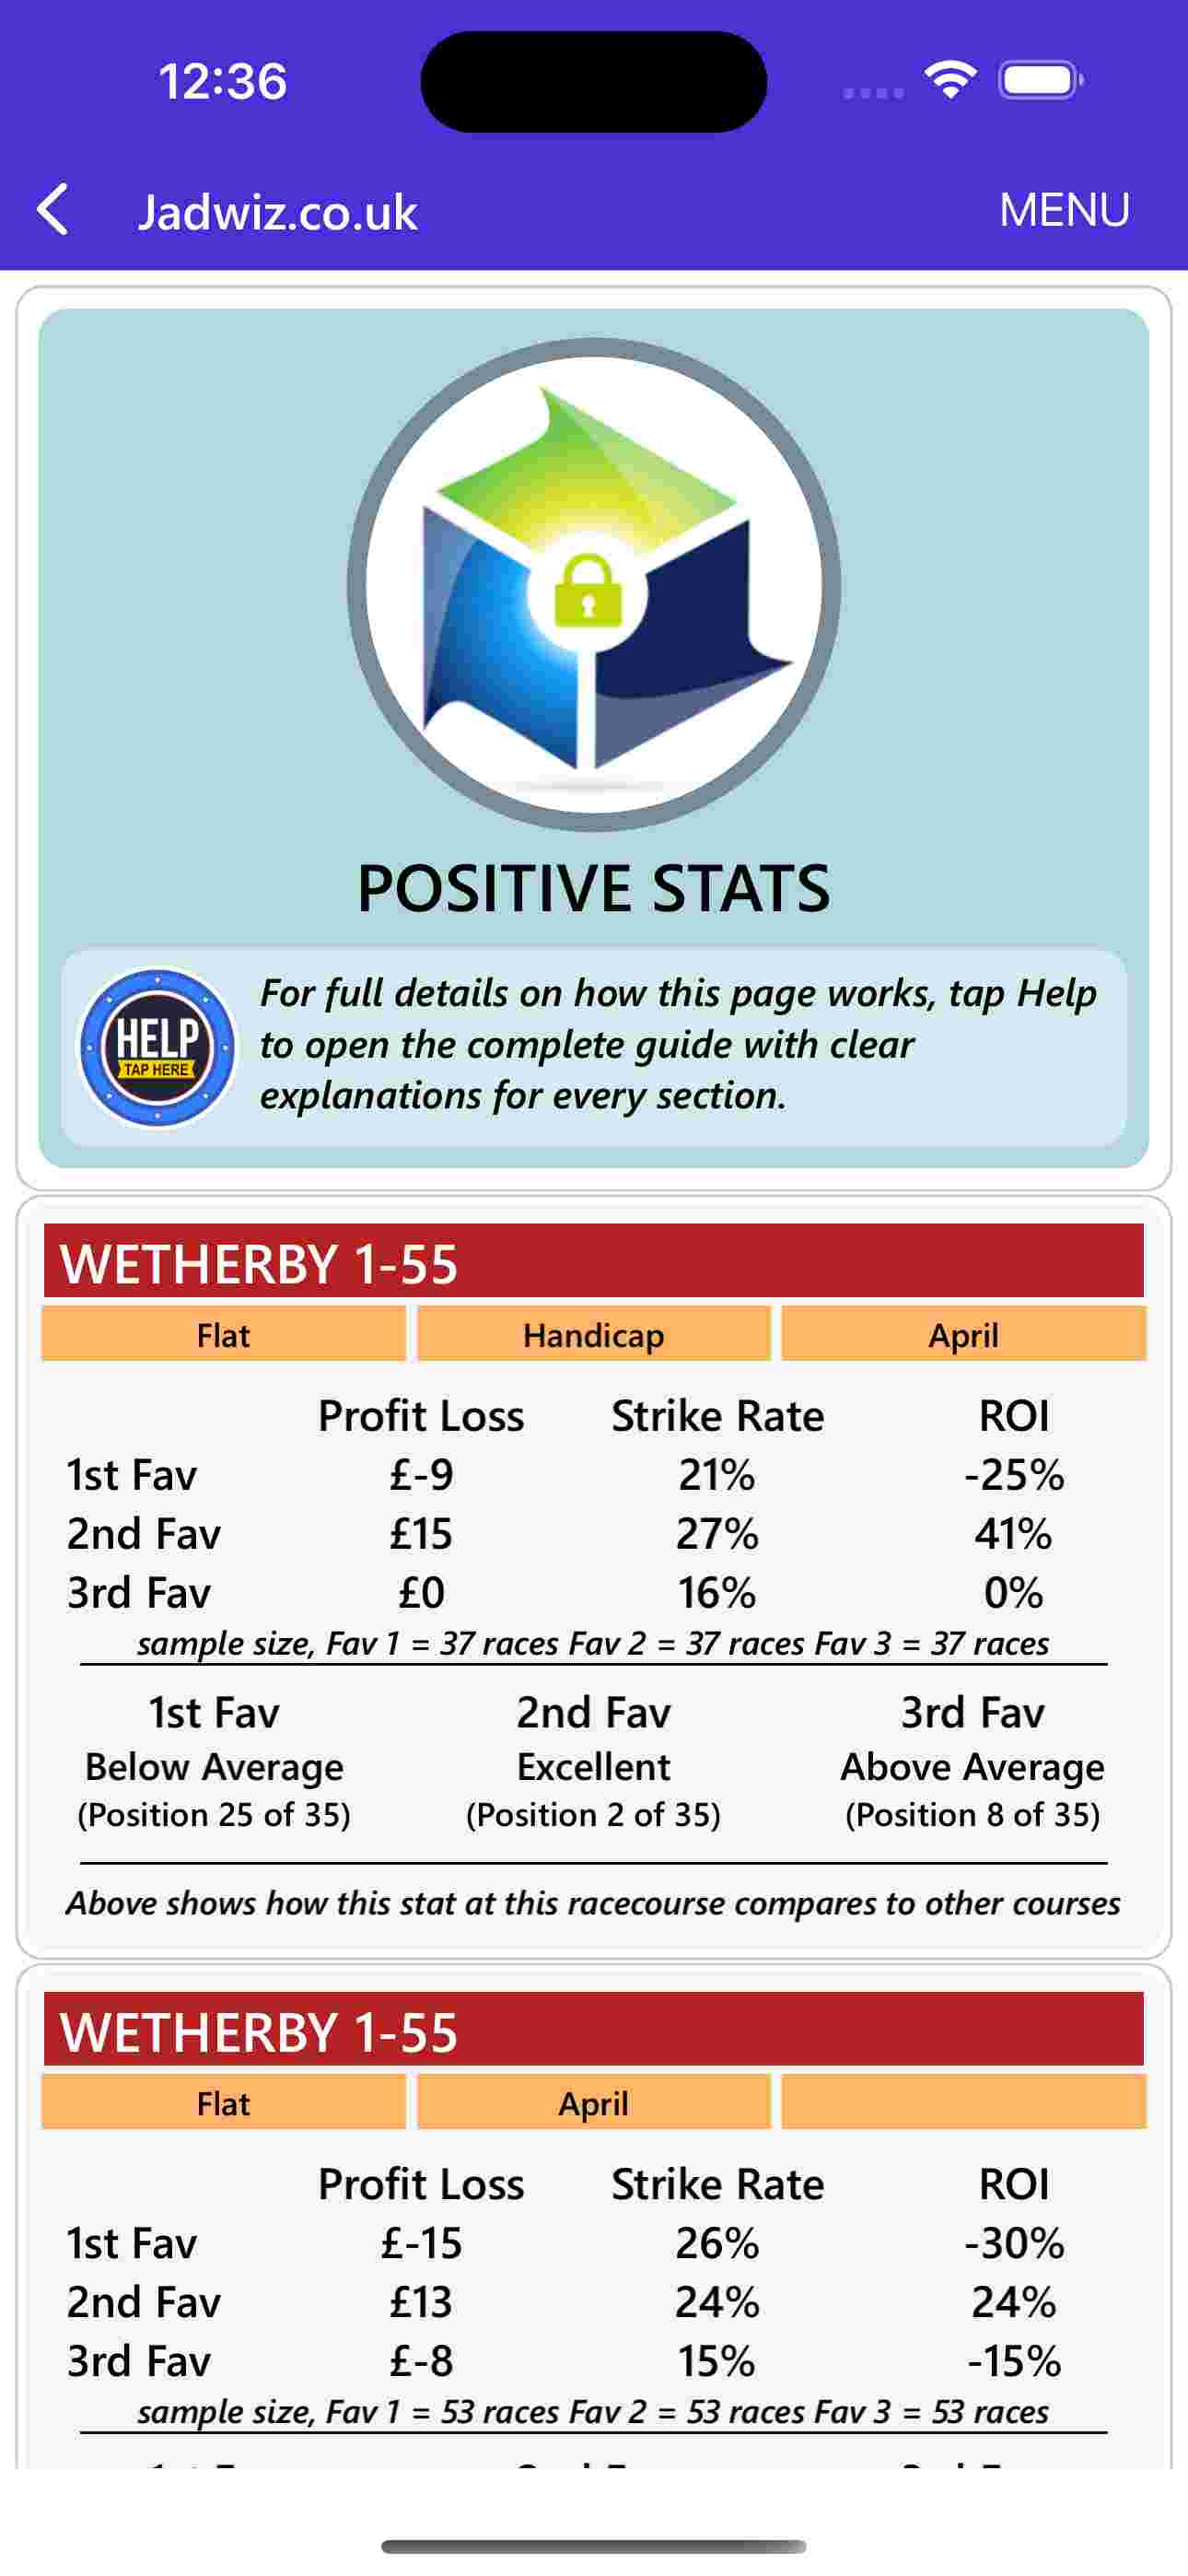
What qualifies as a Positive Stat
A stat qualifies as “positive” if:
- It has 35+ races
- It shows at least +25% ROI
- It ranks well compared to other racecourses
For example: Class 4, Tuesday, 3rd Favourite — ROI +24%, ranked 3rd of 35 racecourses.
Positive Stats help you understand why a favourite is rated Excellent or Above Average.
What Positive Stats show
Each Positive Stat includes:
- The filters used
- Profit/Loss
- Strike Rate
- ROI
- Sample size
- Ranking among all UK racecourses
Some races have several positive stats. Others may have none—which is useful information in itself.
Top Selections
Top Selections give you three standout picks for the day:
- One for the 1st favourite
- One for the 2nd favourite
- One for the 3rd favourite
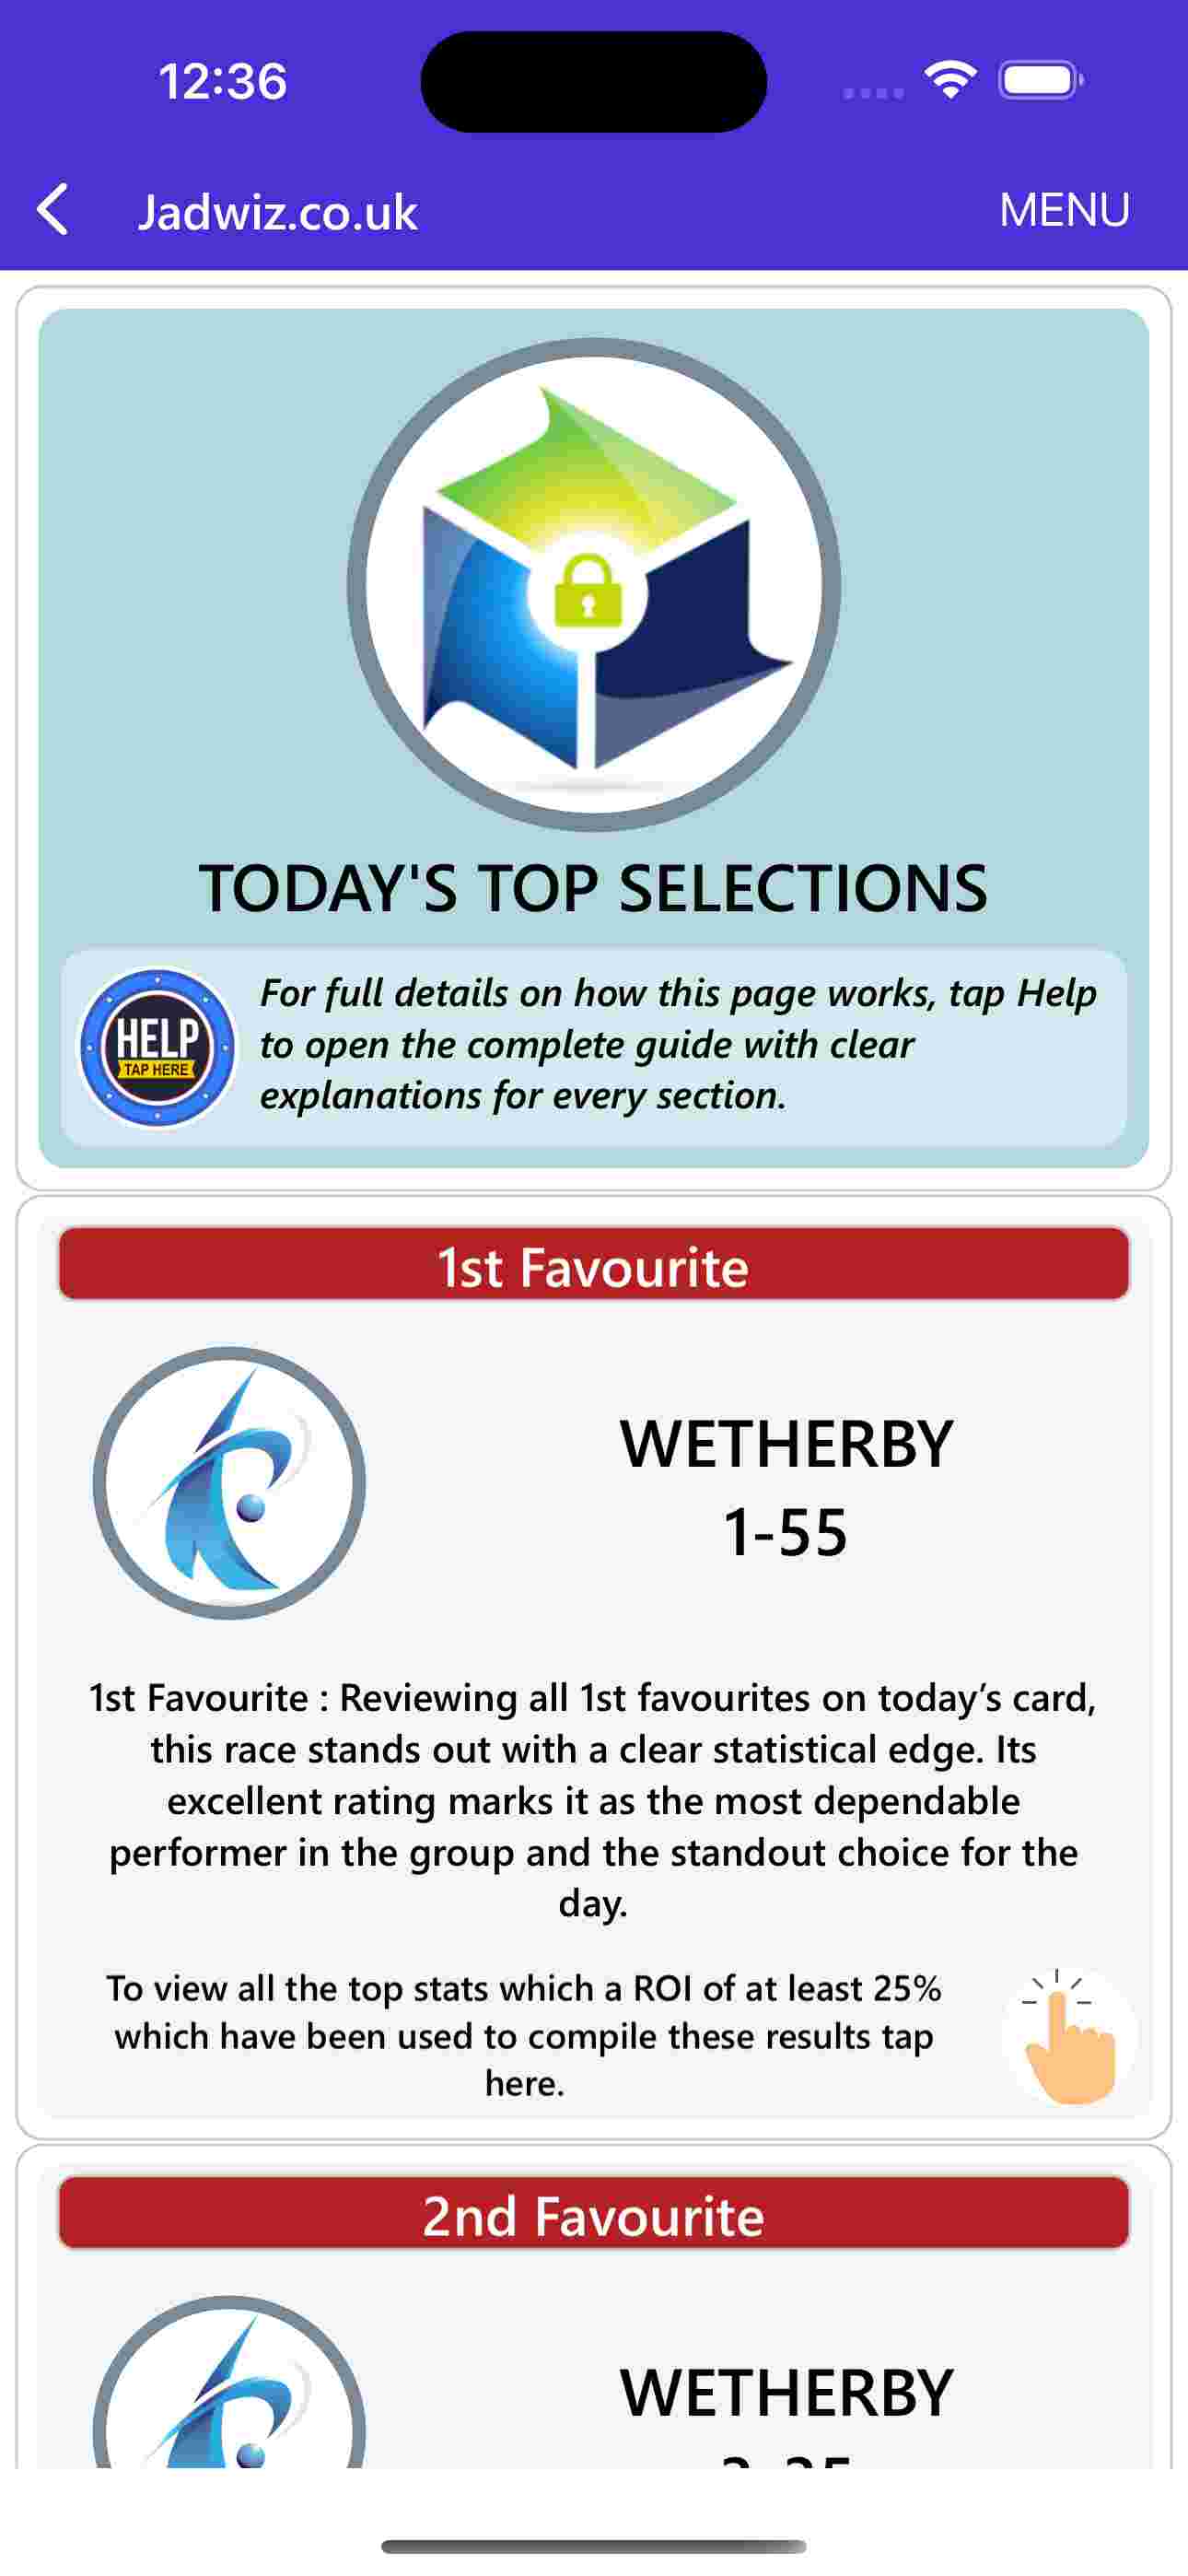
These are chosen using:
- Long term performance
- Today’s conditions
- Positive Stats
- Overall ratings
Each selection can be tapped to reveal any Positive Stats that support it.
When to use Top Selections
They’re ideal when:
- You want a quick shortlist
- You’re at the races
- You only have a few minutes
- You want the strongest angles of the day
Top Selections are the fastest way to get race day clarity.
Using graphs
Graphs help you understand how a stat achieved its profit—not just the final number.
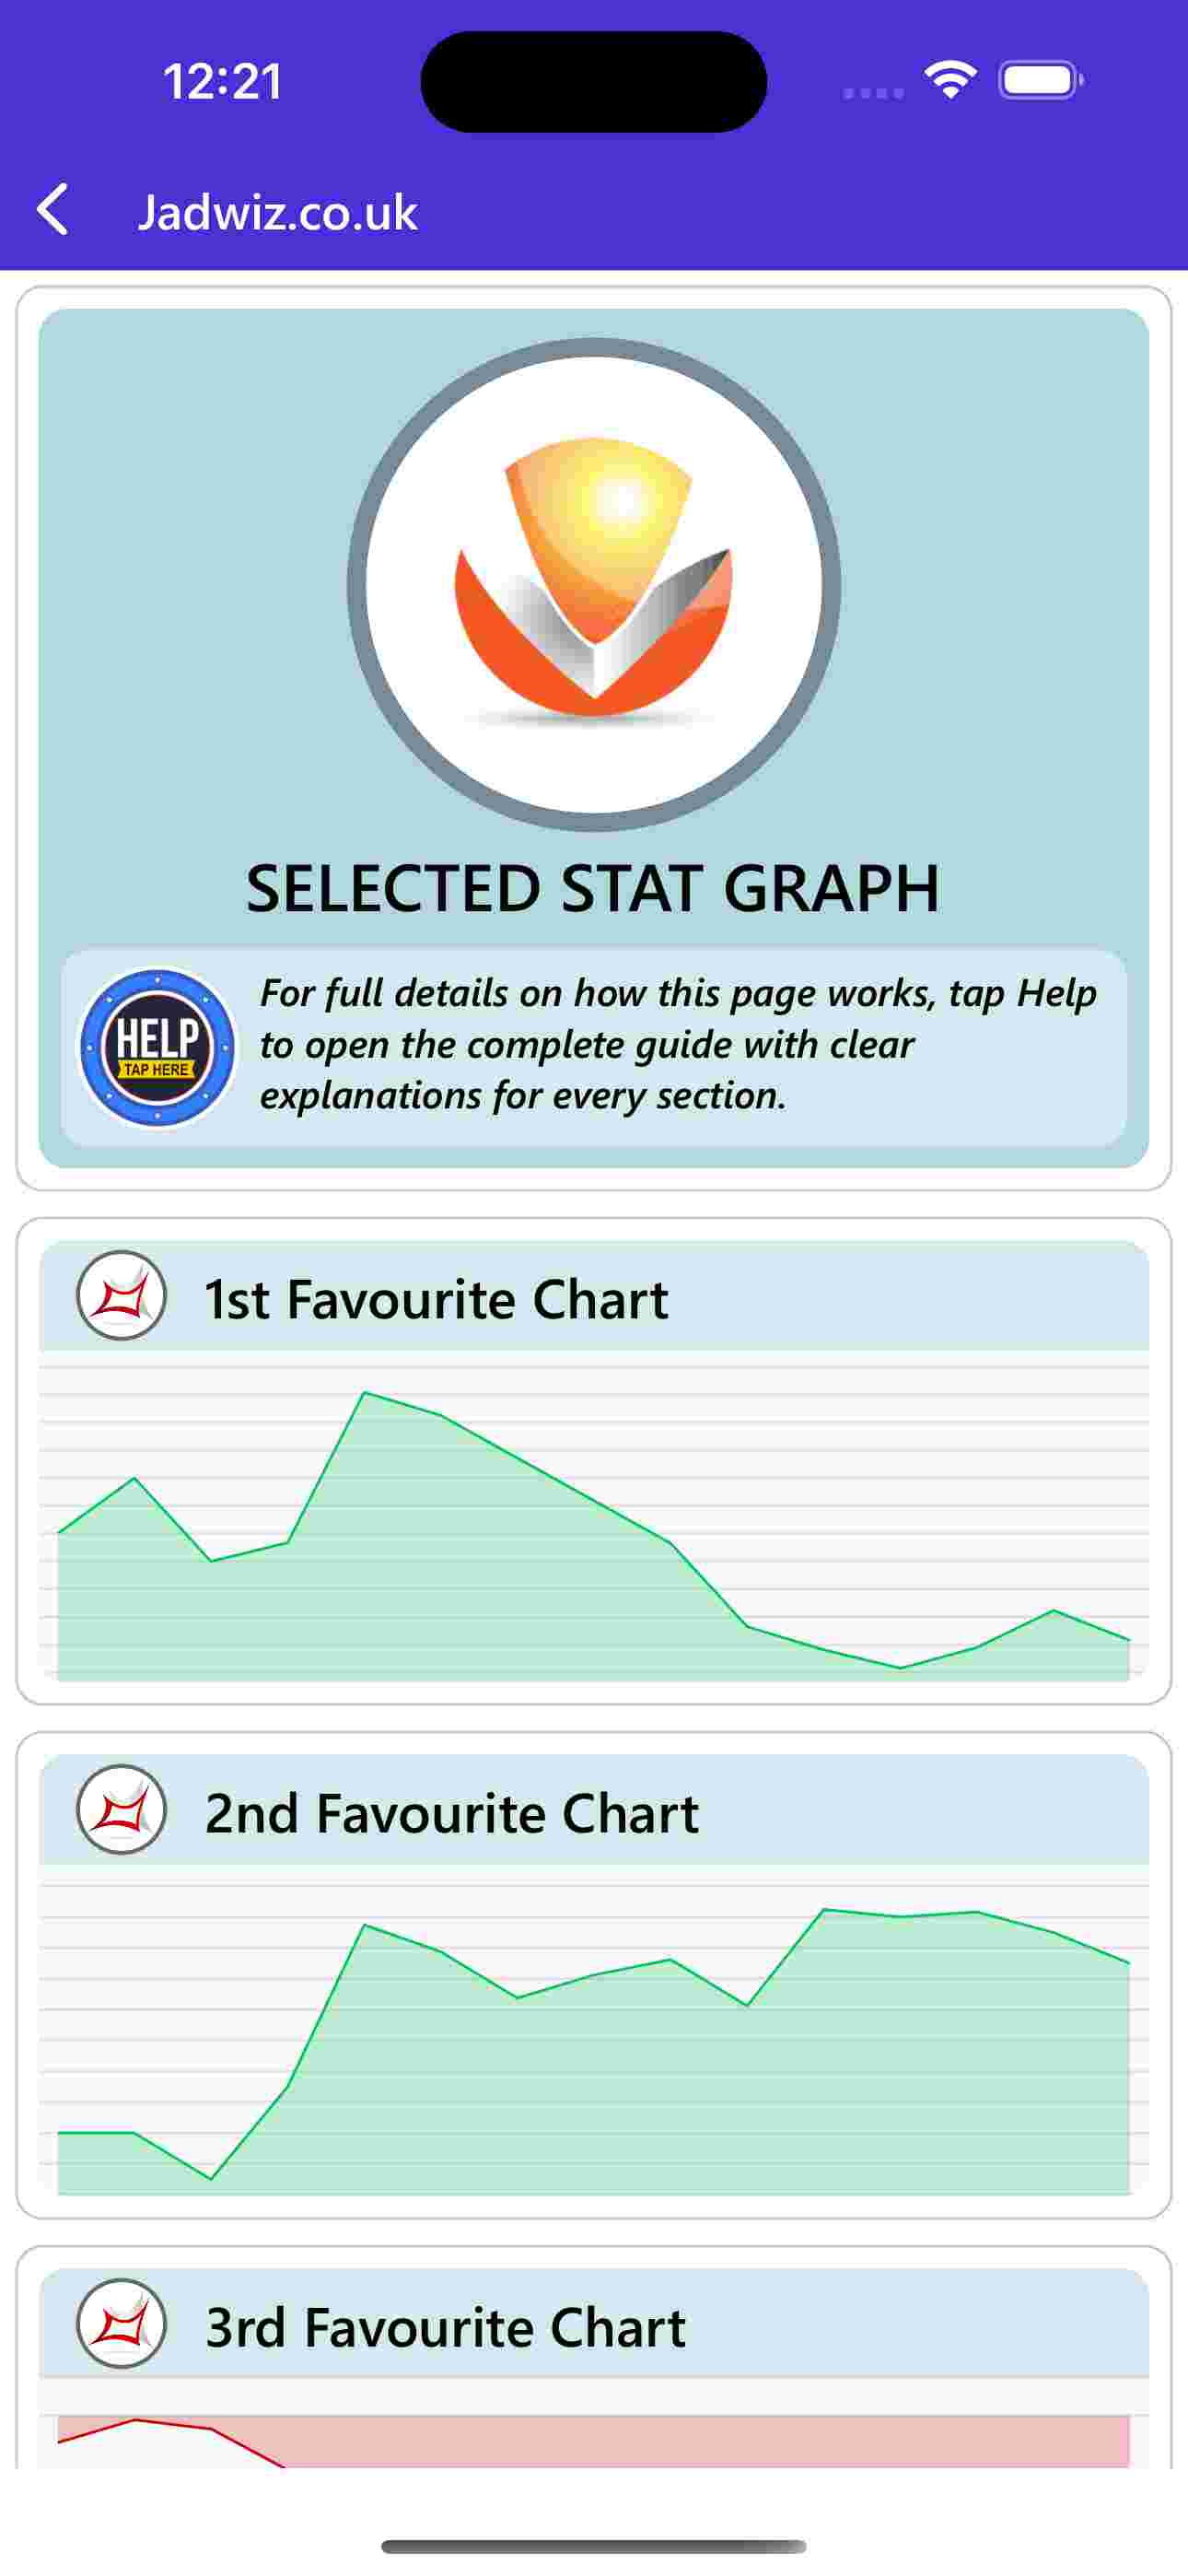
Sometimes a stat looks profitable, but the graph reveals:
- A big spike early on
- Followed by years of decline
Other times, the graph shows:
- A steady, consistent climb
- A reliable long term pattern
How to view a graph
- Tap the stat
- Scroll to the bottom
- Tap View Graph
Why graphs matter
They help you avoid:
- False positives
- Stats that only look good because of one lucky run
- Unstable patterns
And they help you find:
- Long term consistency
- Reliable angles
- Stats worth saving
Comparing stats
The Compare Stats feature lets you see how a stat ranks across all UK racecourses.
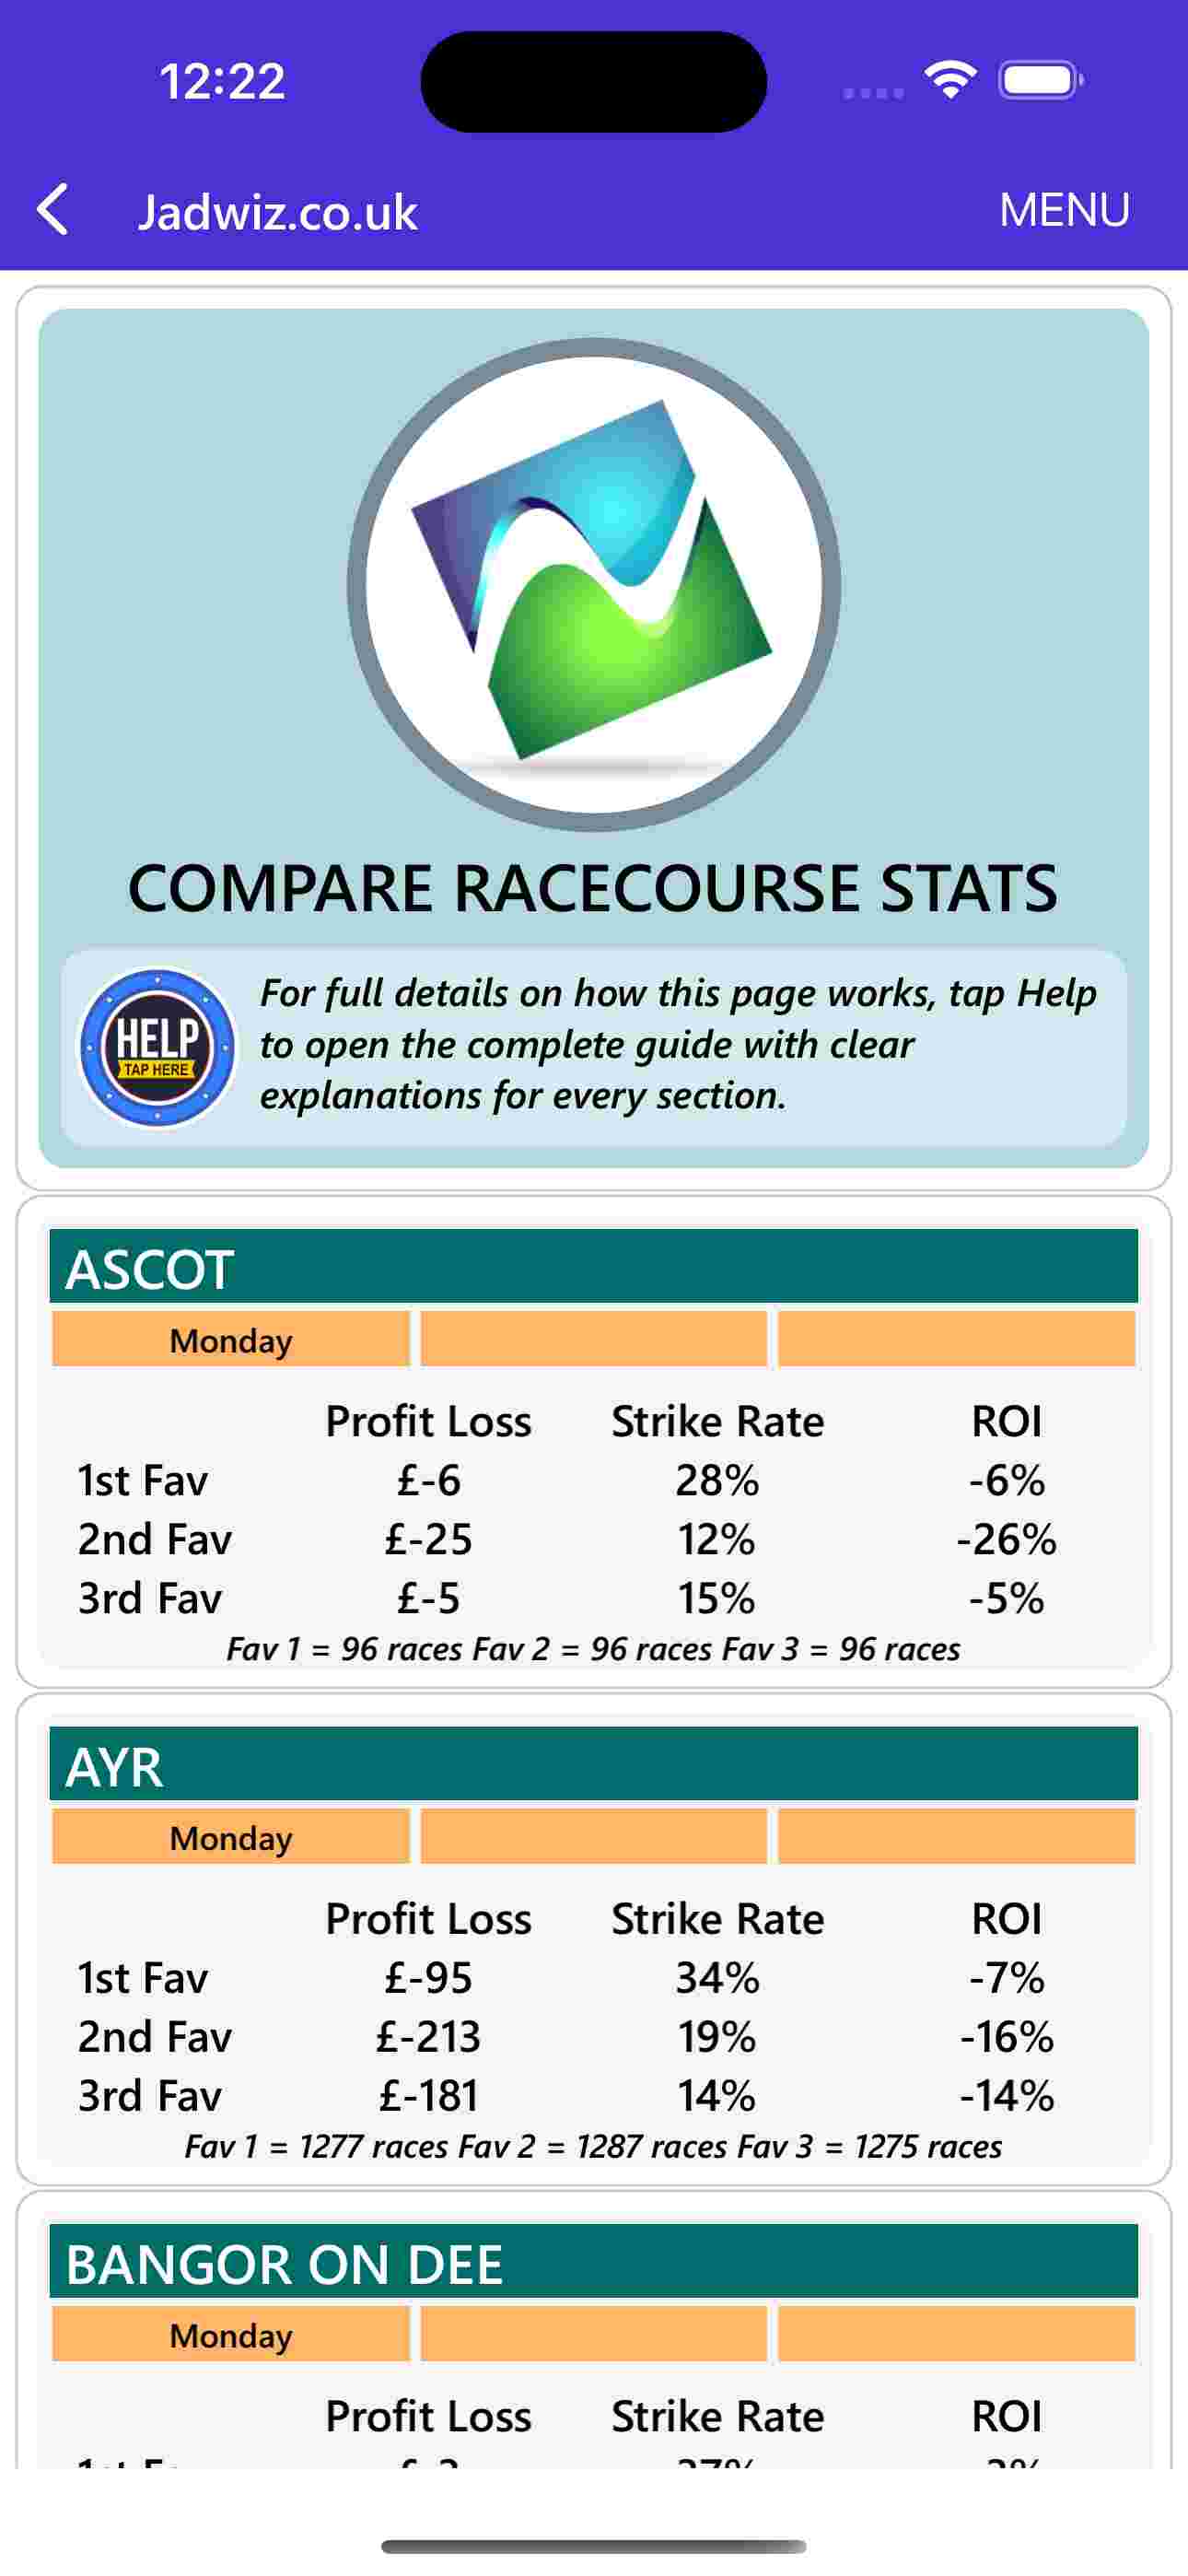
For example:
Class 4, 8f, Tuesday — 1st Favourite ROI +52%, ranked near top of list.
This gives you context:
- A stat might be profitable
- But if it ranks 30th of 56, it’s not as strong as it looks
- If it ranks 1st–5th, it’s exceptional
How to compare
- Tap the stat
- Scroll to the bottom
- Tap Compare Stats
Important: All databases must be installed
To compare across all racecourses, you need all racecourse databases installed.
The easiest way:
- Open My App Health
- Tap Install Missing Databases
The app will download and install everything automatically, then confirm when complete.
My App Health
The My App Health page gives you a quick overview of the app’s status.
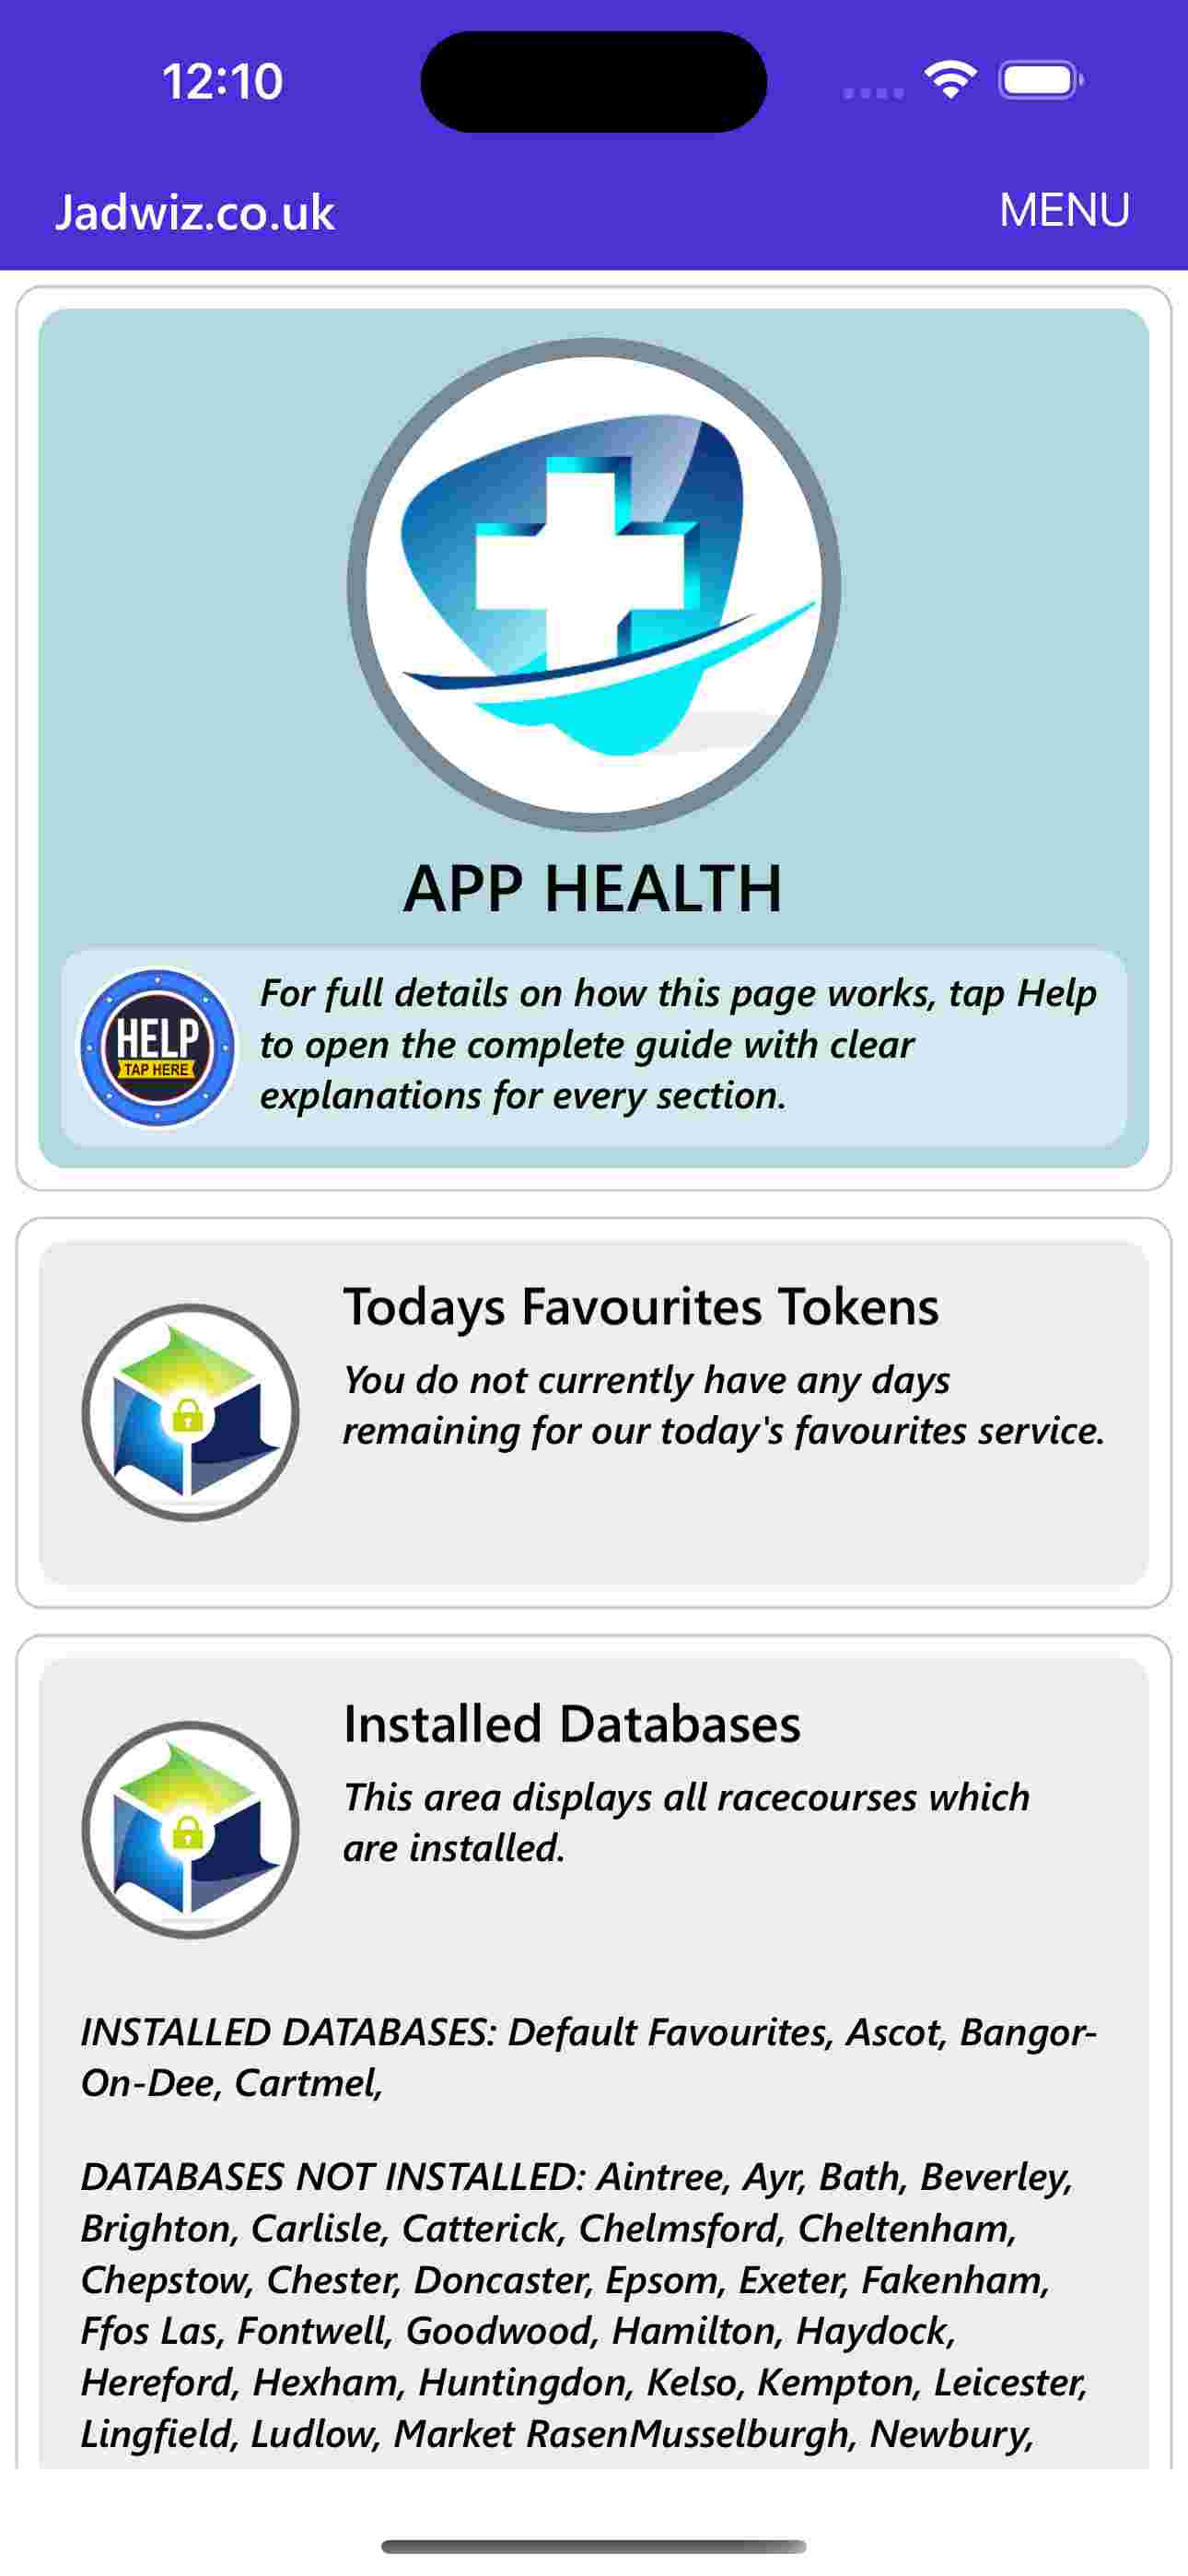
Here you can see:
- How many days remain on Today’s Favourites
- Which Premium Stats racecourses are unlocked
- App version number
- Whether any racecourse databases are missing
Install Missing Databases
If you plan to use Compare Stats—or just want the app fully prepared—tap Install Missing Databases.
The app will:
- Download any missing racecourse files
- Install them automatically
- Confirm when everything is complete
Special Offers
The Special Offers page is where you can find discounts and occasional limited‑time deals.

It’s worth checking regularly because offers may include:
- Reduced price Today’s Favourites
- Discounts on Premium Stats
- Free unlock tokens
- Seasonal promotions
If you have a promo code, enter it at the bottom of the page in the text box provided. This area is simple, but it can save you money—especially if you’re unlocking several racecourses.
Tips, tricks & best practices
- Always start with Day of Week – keeps everything organised and makes saving stats easier.
- Save stats into day‑of‑week folders – Sunday, Monday, Tuesday, etc., so you only check what matters today.
- Use Last Saved Stat – see exactly where you left off when working through filters or racecourses.
- Use graphs to avoid misleading stats – big early spikes can hide long term decline.
- Use Compare Stats for context – profit alone isn’t enough; top‑ranked stats are far more reliable.
- Use Premium Stats for speed – reliable long term angles, clean organisation, instant access, day‑of‑week grouping.
- Use Today’s Favourites for race day clarity – ratings, Positive Stats, Top Selections, and a final favourite recommendation.
- Spend 5 minutes a day – check today’s racing, check your saved stats, add one or two new stats, and use Last Saved Stat to continue your routine. Over time, you’ll build a powerful personal stat library.
Summary
You now know how to use every part of the Jadwiz Favourites app.
Two ways to use the app
Free Method
- Explore Favourite Stats
- Apply filters
- Save your own stats
- Build a personal library
- Use Starter Stats
- Use graphs and Compare Stats
Premium Method
- Unlock Premium Stats
- Use Today’s Favourites
- Check Top Selections
- View Positive Stats
- Get instant race day clarity
The app is built around one simple idea: the first three favourites win two thirds of all races. By understanding how they behave under different conditions, you can make smarter, faster decisions.
Whether you’re researching, saving stats, or using premium features, the app gives you everything you need to find long term patterns and race day opportunities.
The first three favourites win two‑thirds of all races. By understanding how they behave under different conditions, we can make smarter, faster decisions.
Horse Racing Favourites App
-
 Beginners Guide
for the beguiners guide click here -
 Navigating The App
for navigating the app click here -
 Understanding Favourite Stats
for understanding favourite stats click here -
 Using Filters
for using filters click here -
 Finding Your Own Stats
for finding your own stats click here -
 Saving Stats
for saving stats click here -
 My Saved Stats
for my saved stats click here -
 Premium Stats
for premium stats click here -
 Todays Favourites
for todays favourites click here -
 Positive Stats
for positive stats click here -
 Top Selections
for top selections click here -
 Using Graphs
for using graphs click here -
 Comparing Stats
for comparing stats click here -
 My App Health
for my app health click here -
 Special Offers
for special offers click here -
 Summary
for summary click here